BTS 2-Week Outlook
Bureau of Transportation Statistics Upcoming Releases
September 16-27
Upcoming from September 16
Monday, September 16, 2019 - 11:00am ET
Airline Financial Data, 2nd Quarter 2019
Tuesday, September 17, 2019 - 11:00am ET
Airline On-Time/Tarmac Data, July 2019
Tuesday, September 17, 2019 - 2:00pm ET
Passenger Airline Employment, July 2019
Tuesday, September 24, 2019 - 11:00am ET
North American Freight Data, July 2019
Previously Released
September 4 - Airline Fuel Cost and Consumption, July 2019
September 10- Airline Full-Time/Part-Time Employment, July 2019
September 12 - Transportation Services Index, July 2019
September 13 - Airline Traffic Data, August 2019 Estimated, June 2019 Reported
The Bureau of Transportation Statistics will release the following data sets in the next two weeks:
-
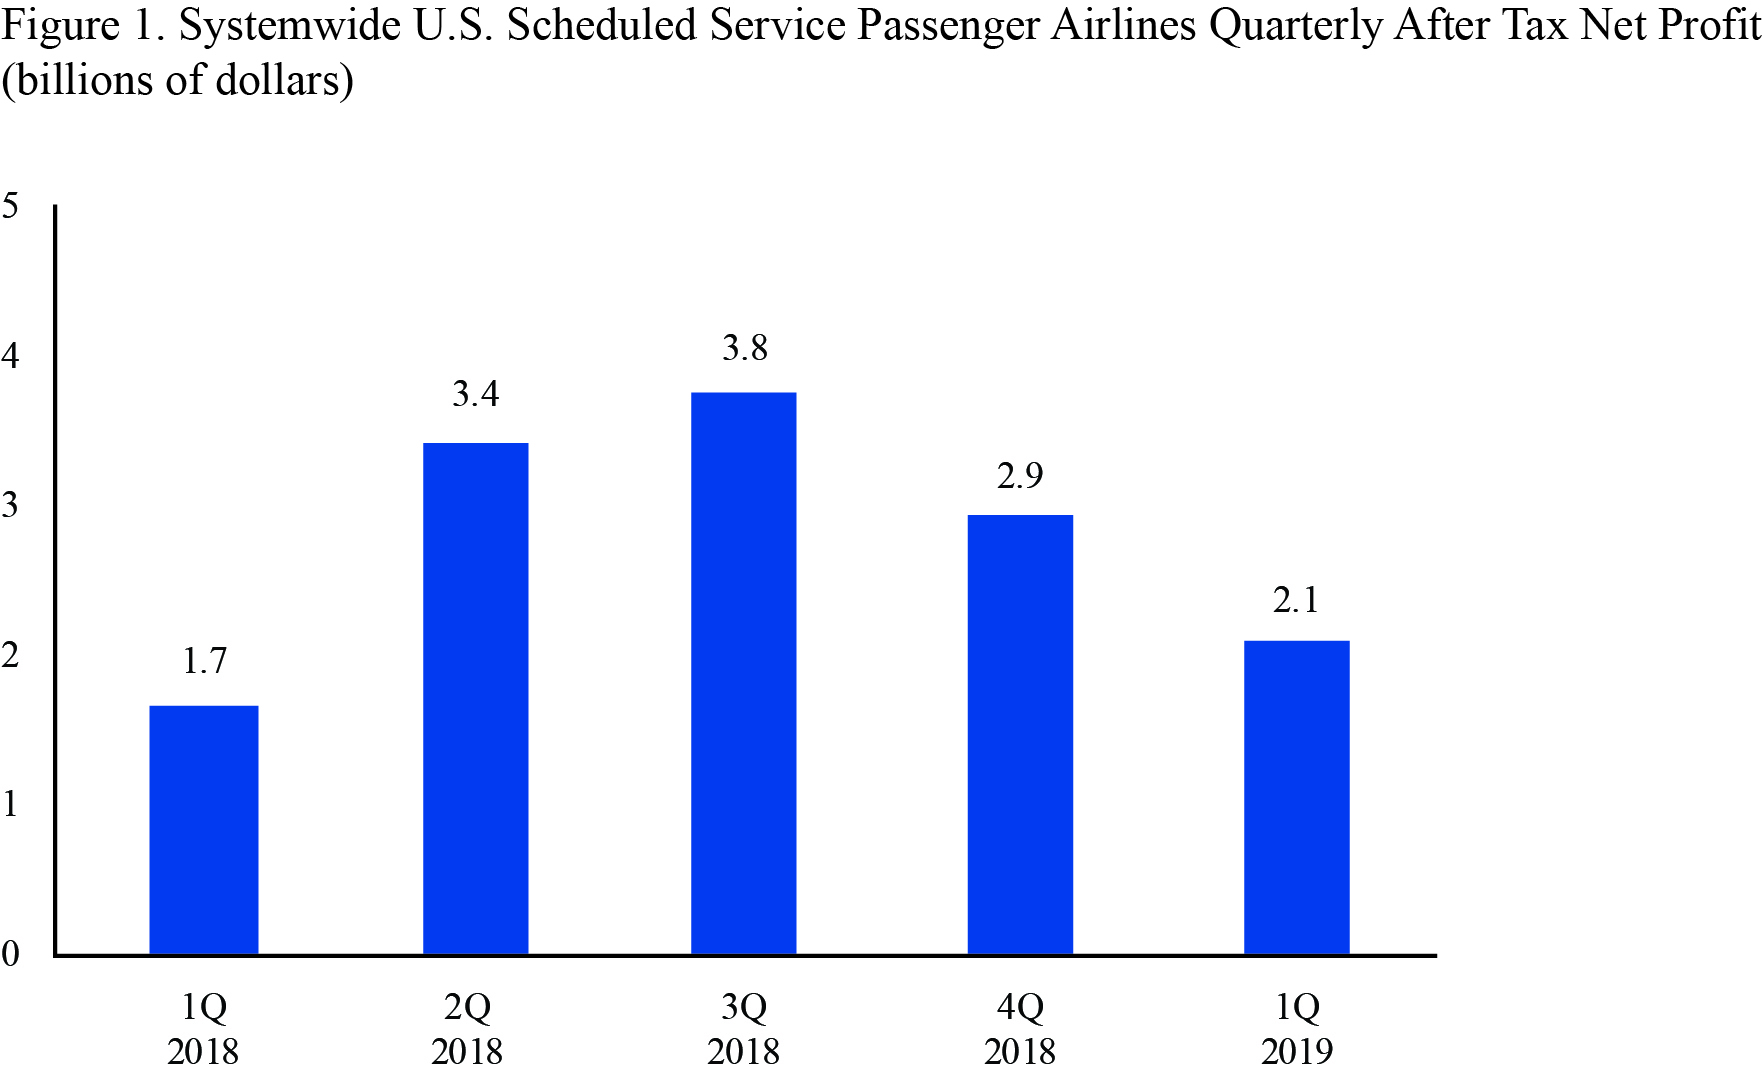
US. Airline Financial Data, 2nd Quarter 2019
Monday, September 16, 2019 - 11:00am ET
The release summarizes annual and quarterly net profit, operating profit, operating revenue and operating expenses for the U.S. scheduled service passenger airlines for systemwide, domestic and international operations. The BTS first-quarter 2019 release said that U.S. scheduled passenger airlines reported a first-quarter 2019 after-tax net profit of $2.1 billion, the 24th consecutive annual after tax profit, and a pre-tax operating profit of $3.3 billion, the 32nd consecutive quarterly pre-tax profit... Additional financial numbers for all airlines will be available on the BTS financial databases.
-
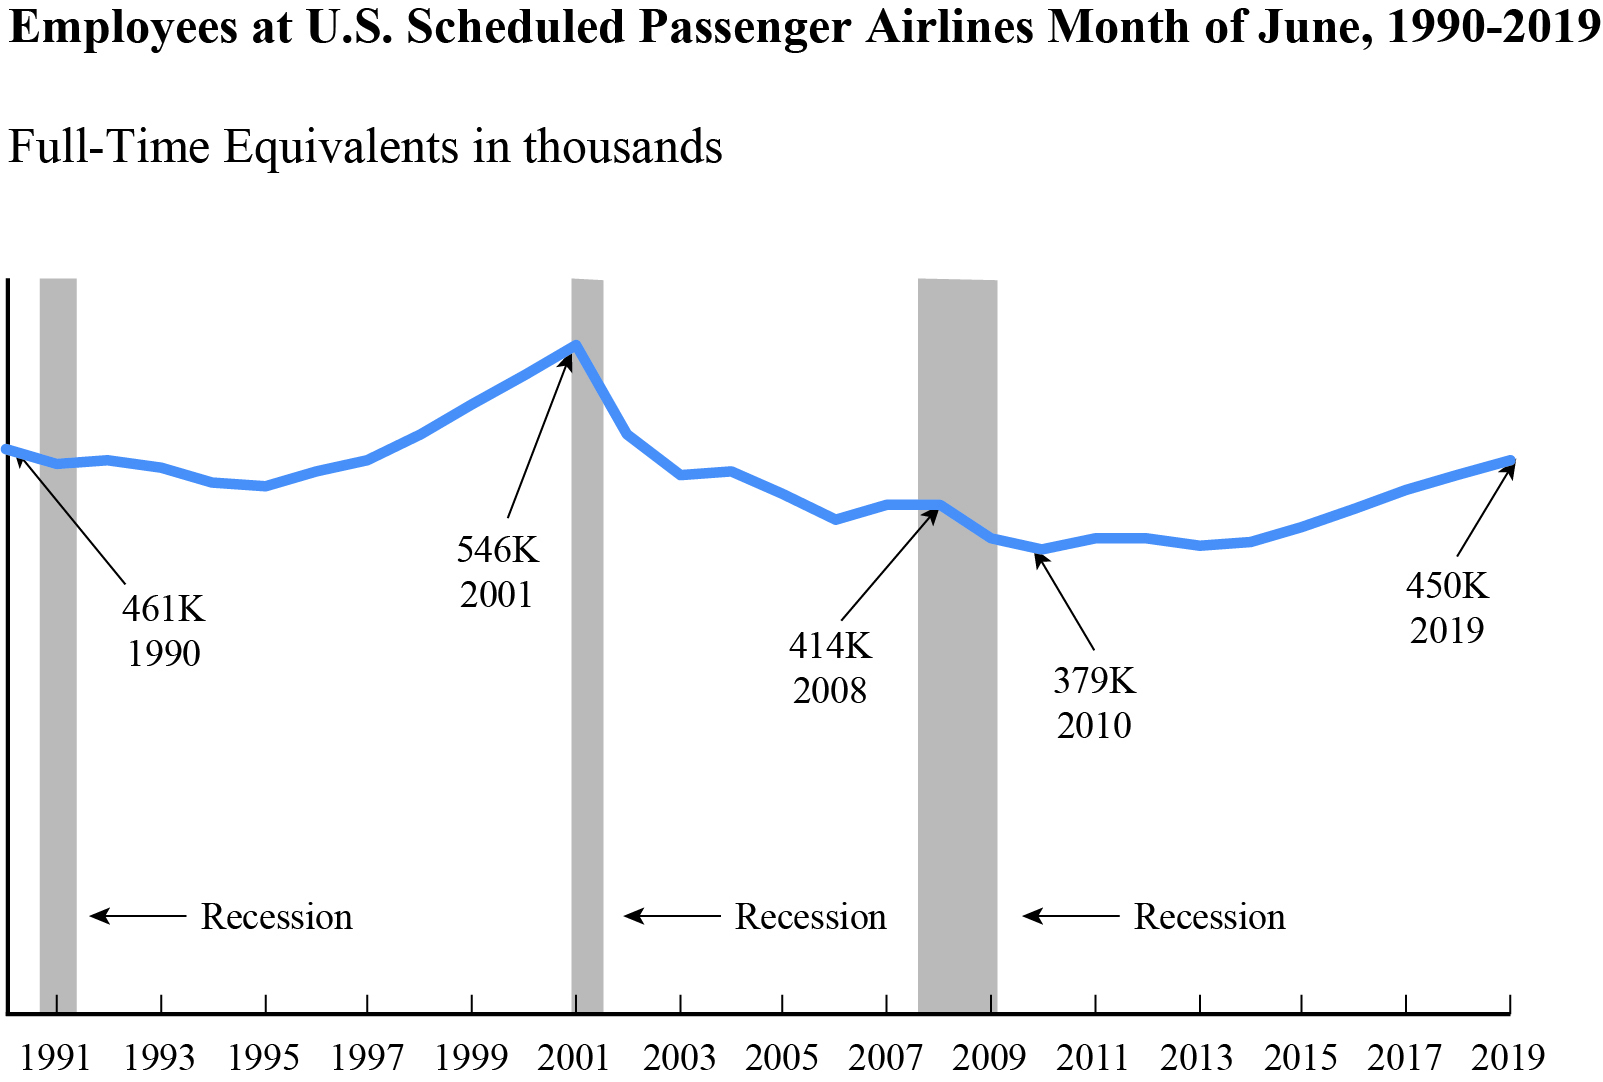
Passenger Airline Employment, July 2019
Tuesday, September 17, 2019 - 11:00am ET
The release details full-time equivalent (FTE) employment numbers for U.S. scheduled service passenger airlines. Previously, BTS reported that U.S. scheduled passenger airlines employed 2.4% more workers in June 2019 than in June 2019. June’s 449,985 full-time equivalents (FTEs) was the highest employment total for any month since March 2003 (458,598 FTEs) and was the 68th consecutive month that U.S. scheduled passenger airline FTEs exceeded the same month of the previous year.
-
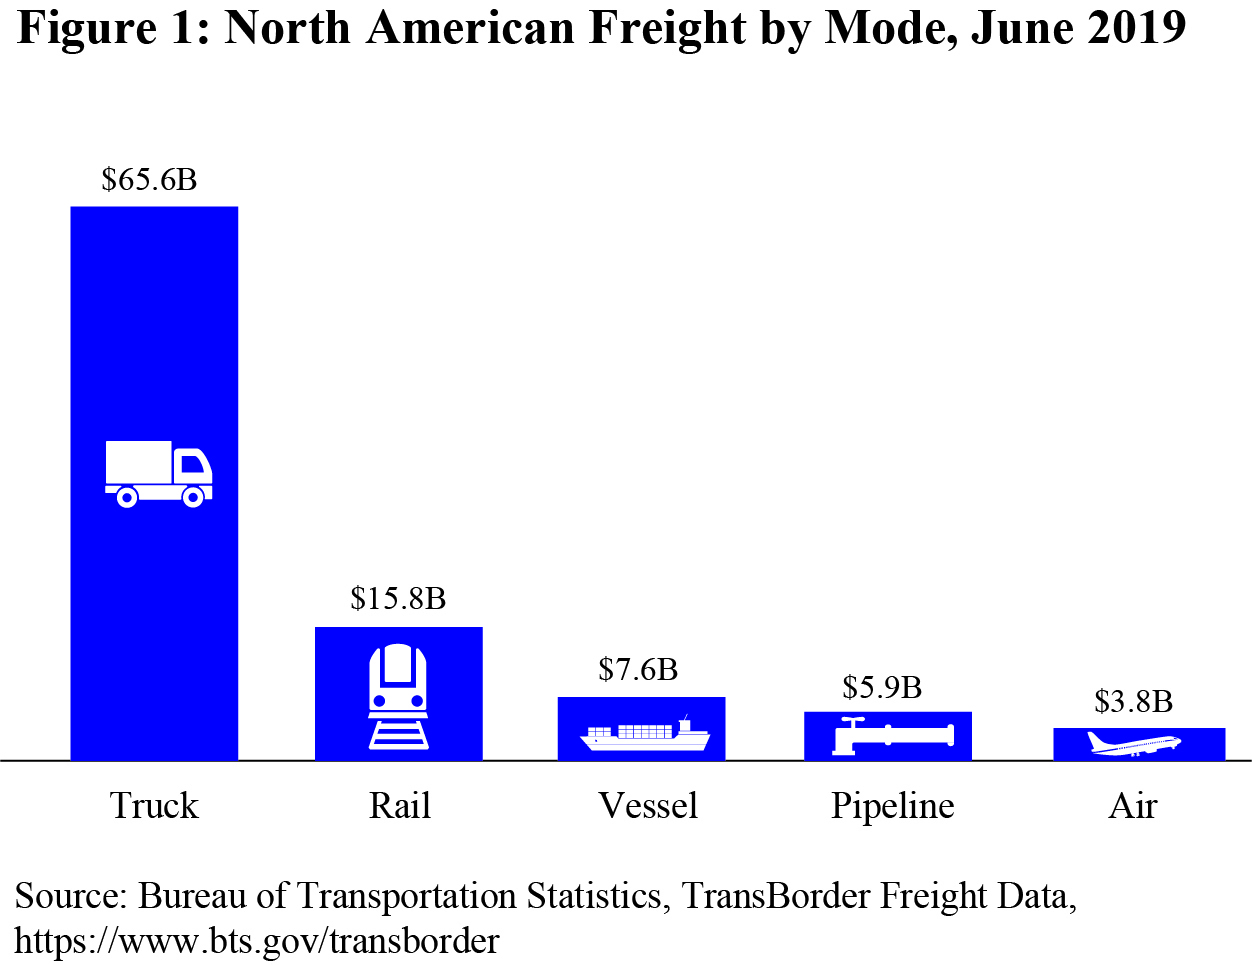
North American Transborder Freight Data, July 2019
Tuesday, September 24, 2019 - 11:00am ET
The release summarizes the value of freight transported in June by truck, rail and other modes between the U.S. and Canada and the U.S. and Mexico with the top states, ports and commodities. Previously, BTS reported that the value of total Transborder freight in June was $103.8 billion, up 2.3% compared to June 2018. Truck moved $66 billion or 63% and rail moved $16 billion or 15%.
-
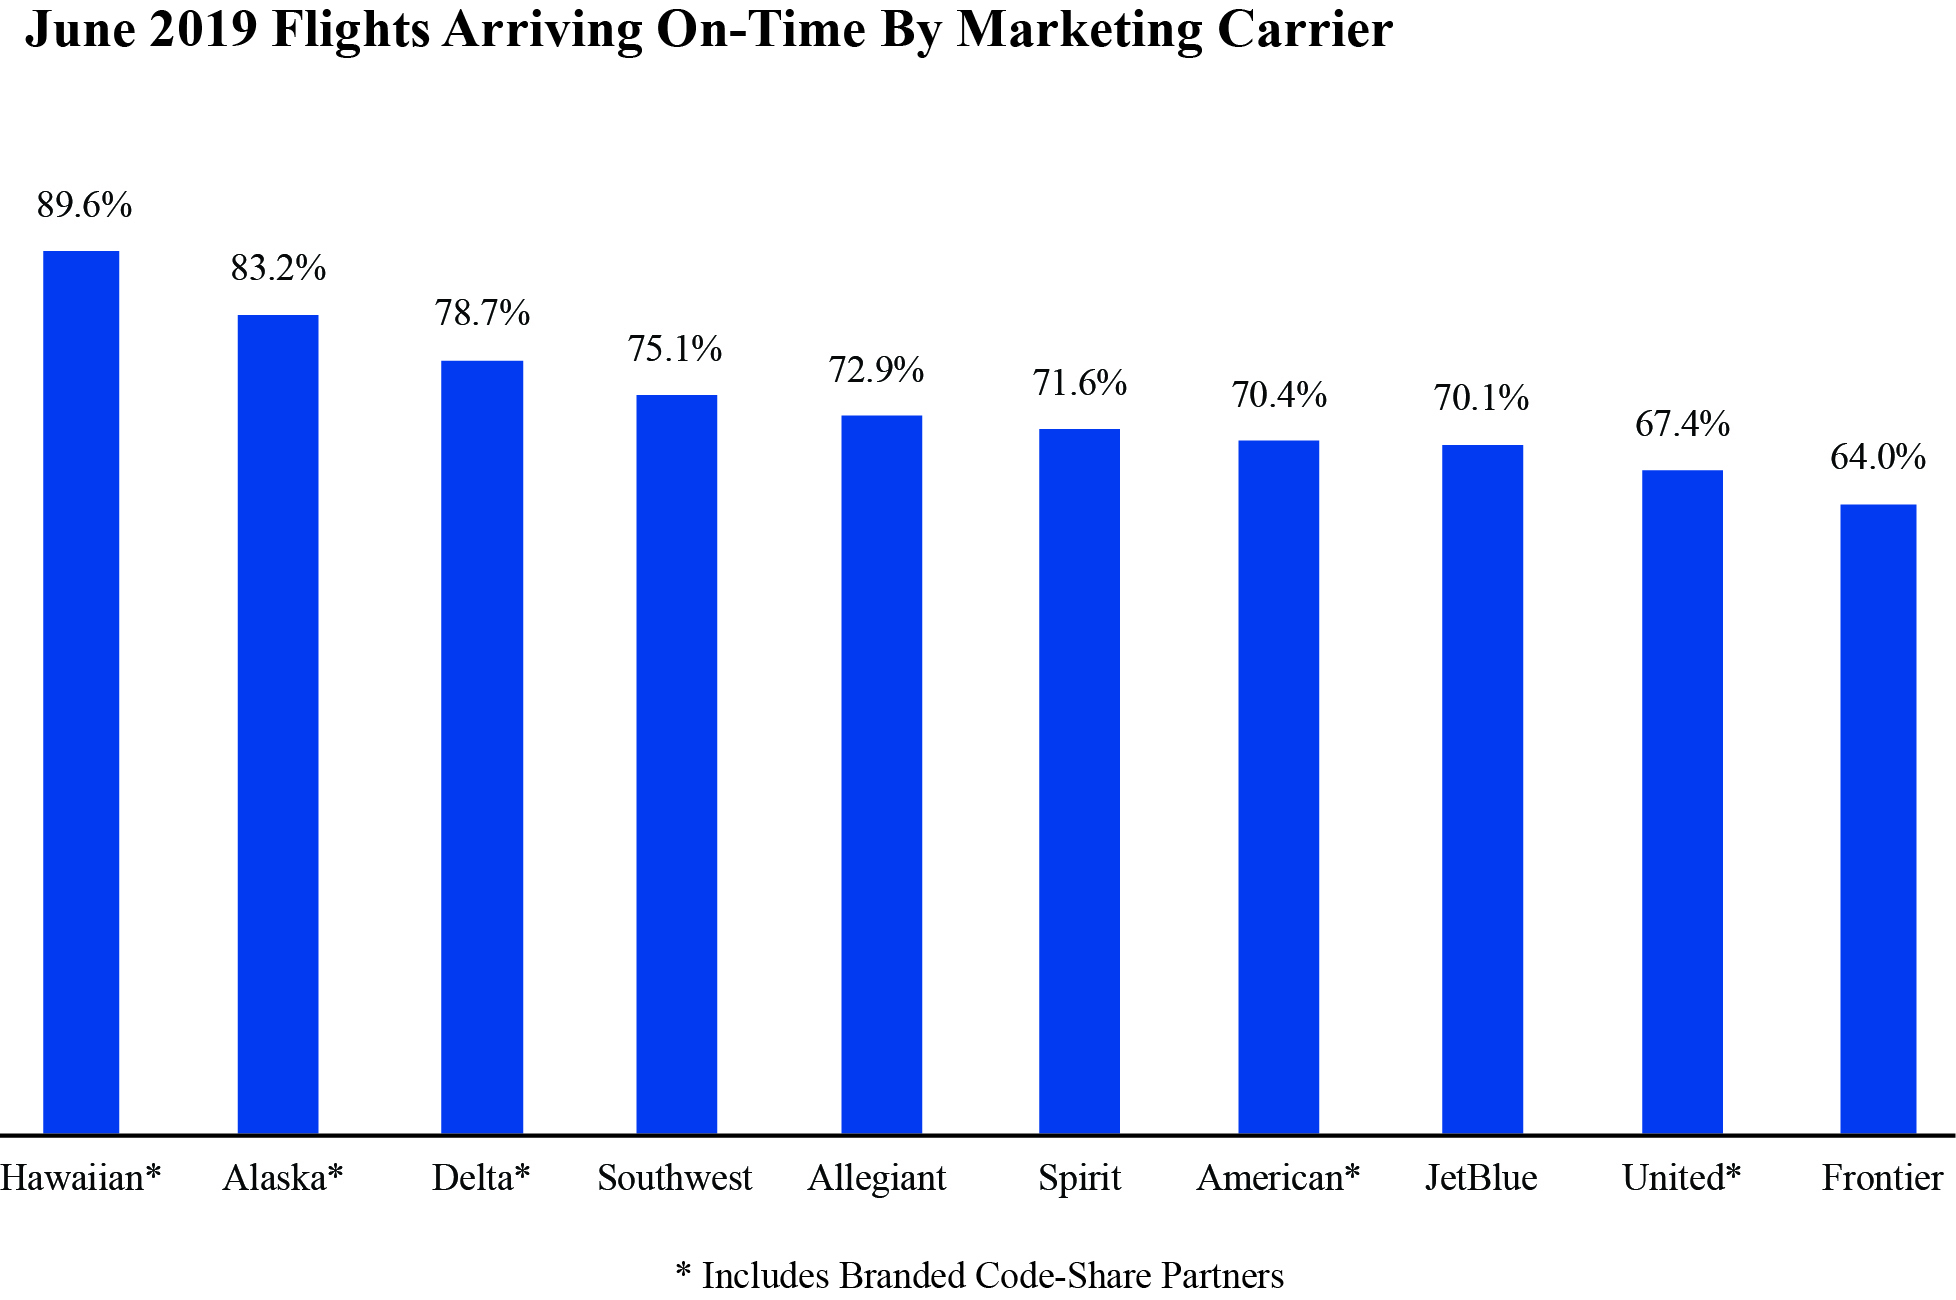
Air Travel Consumer Report: July 2019 Numbers
Tuesday, September 17, 2019 - 11:00am ET
This release consists on U.S. airline domestic monthly on-time performance, cancellations, tarmac data, mishandled baggage and denied boardings released in coordination with the Department of Transportation’s release of the Air Travel Consumer Report. From the previous month’s release, in June 2019 reporting marketing carriers posted an on-time arrival rate of 73.3%, down from both the 77.9% on-time rate in May 2019 and from 76.4% in June 2018. Reporting marketing carriers canceled 2.1% of their scheduled domestic flights, a higher rate than both the rate of 2.0% in May 2019 and 1.8% in June 2018. The marketing carriers include branded code-share partners of mainline carriers.
BTS Previously
BTS has released the following:
-
Airline Fuel Cost and Consumption, July 2019
September 4
U.S. airlines July fuel cost was $1.98/gal, down three cents from June 2019 ($2.01) and down 22 cents from July 2018 ($2.20). Industry summary of airline fuel consumption, total fuel cost and price paid per gallon are available on the database. Individual airline numbers through March are available on the
BTS website.
-
Airline Full-Time/Part-Time Employment, July 2019
September 10
U.S. airlines industry July employment (743,917 total full-time and part-time) was virtually unchanged from June 2019 and up 3.0% from July 2018 (passenger+cargo). Monthly full-time and part-time employment statistics are reported by U.S. airlines that operate at least one aircraft that has more than 60 seats or the capacity to carry a payload of passengers, cargo and fuel weighing more than 18,000 pounds.
-
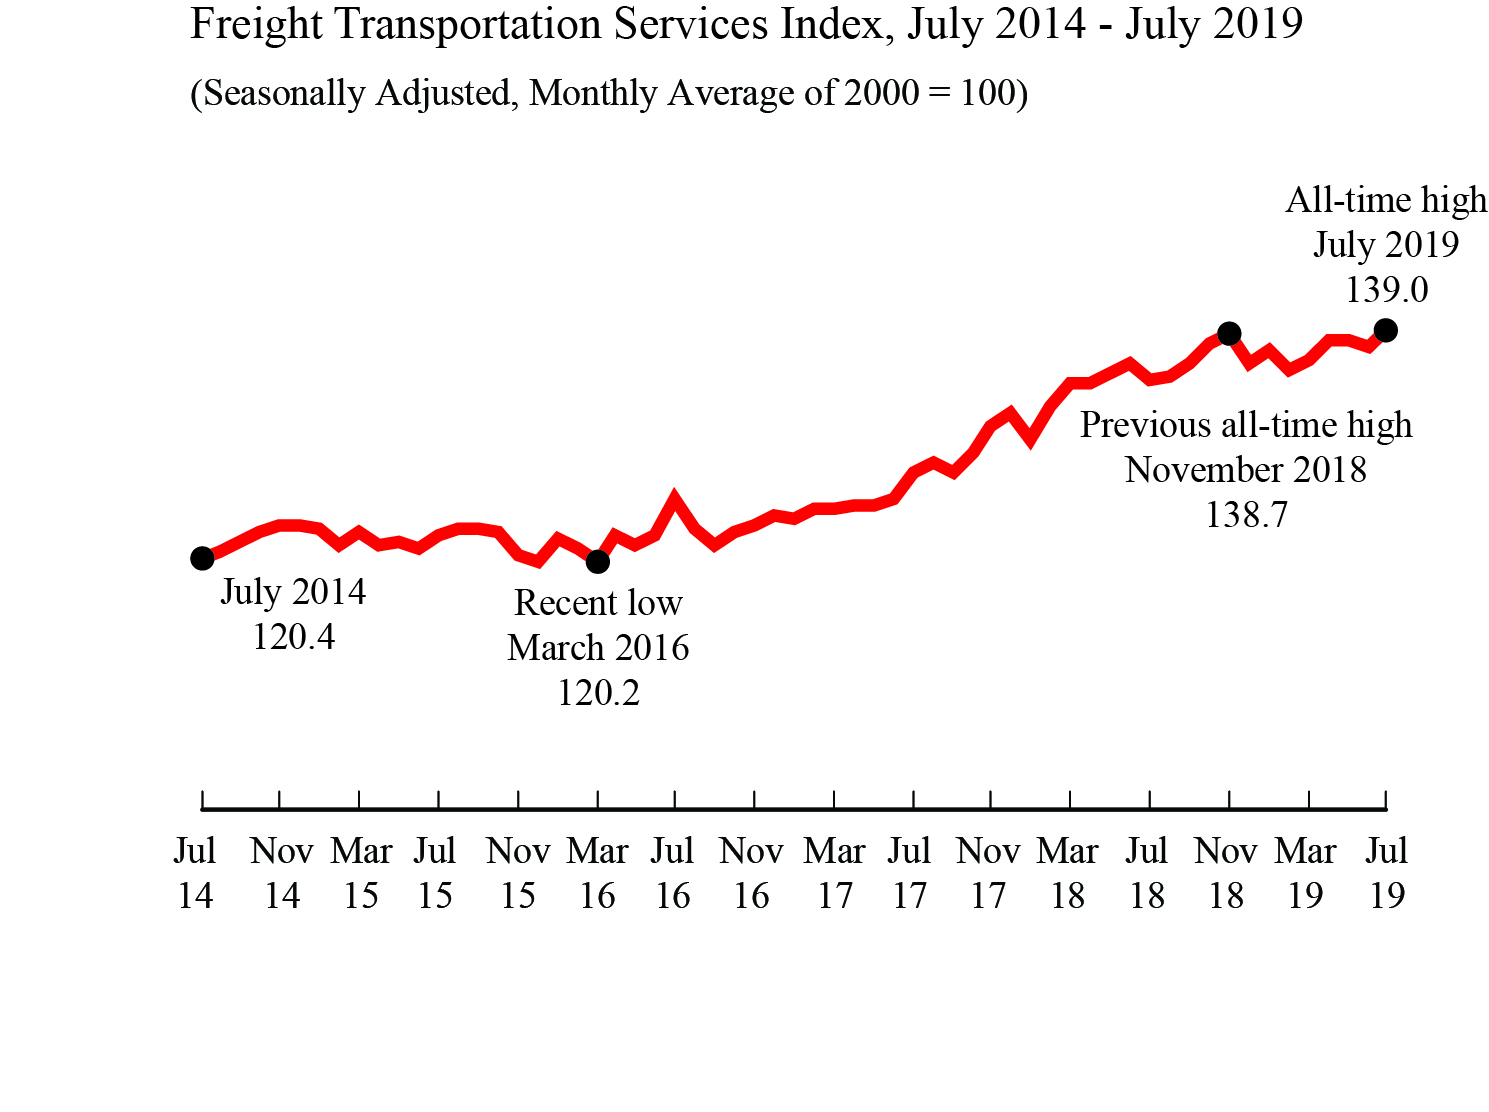
Freight Transportation Services Index (TSI), July 2019
September 12
The Freight Transportation Services Index (TSI), which is based on the amount of freight carried by the for-hire transportation industry, rose 0.9% in July from June, rising to a new all-time high after declining for two consecutive months. From July 2018 to July 2019, the index rose 2.9% compared to a rise of 6.0% from July 2017 to July 2018.
-
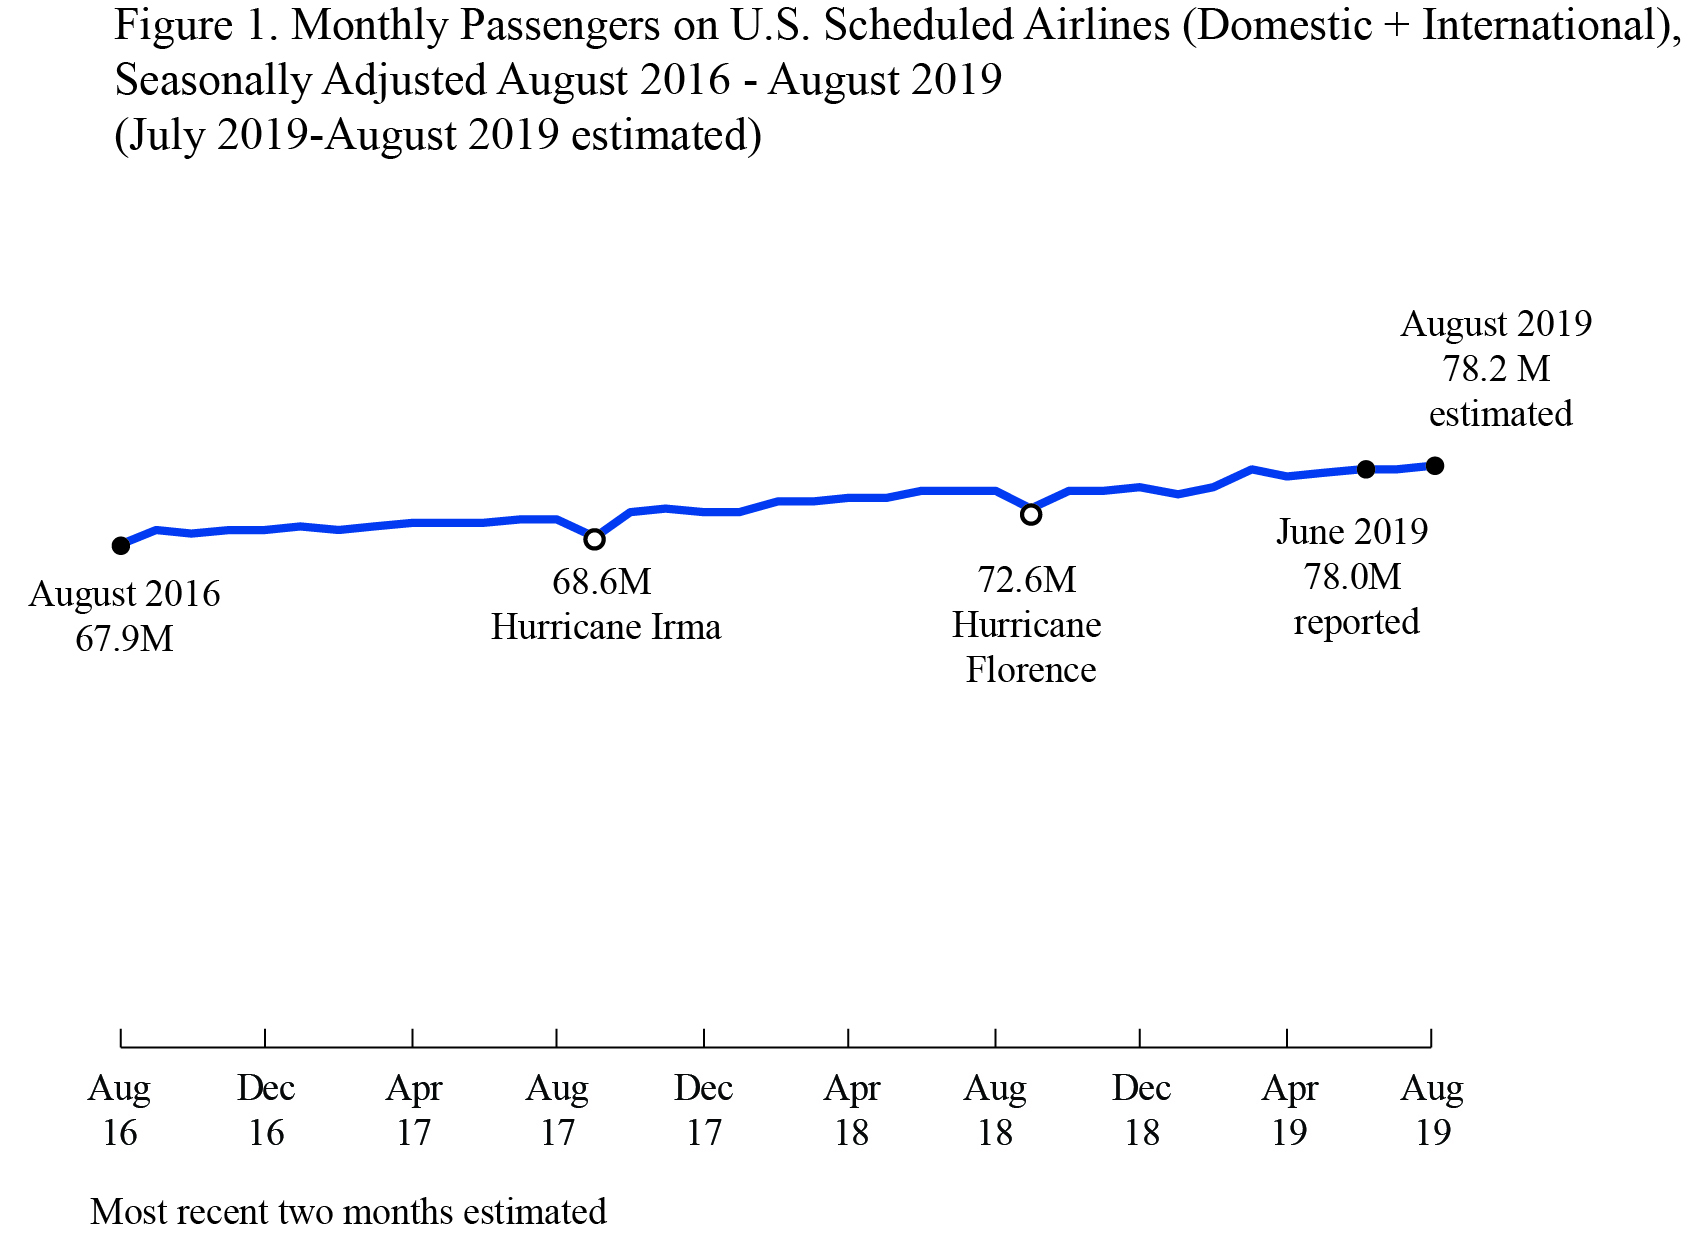
Airline Traffic Data, August 2019 estimate, June 2019 reported
September 13
U.S. airlines carried an all-time high estimated 78.2 million systemwide (domestic and international) scheduled service passengers in August 2019, seasonally-adjusted, according to the Bureau of Transportation Statistics’ (BTS) first estimate, up 0.3% from the July second estimate. The air traffic estimate released is a statistical estimate based on U.S. airlines reported data through June. In unadjusted reported data for June, systemwide, domestic and international enplanements all reached all-time highs for the month of June.
See BTS Release Schedule
BTS Contact: Dave Smallen
202-366-5568


