BTS 2-Week Outlook
Bureau of Transportation Statistics Upcoming Releases
July 22 through August 2
Upcoming from July 22
Wednesday, July 24, 2019 - 11:00am ET
North American Freight Data, May 2019
Previously Released
July 10 - Airline Fuel Cost and Consumption, May 2019
July 11- Airline Full-Time/Part-Time Employment, May 2019
July 11 - Transportation Services Index, May 2019
July 12 - Airline Traffic Data, June 2019 Estimated, April 2019 Reported
July 17 – Domestic Average Air Fares, First Quarter 2019
July 18 - Passenger Airline Employment, May 2019
July 18 – Airline On-Time/Tarmac Data, May 2019
The Bureau of Transportation Statistics will release the following data sets in the next two weeks:
-
North American Transborder Freight Data, May 2019
Wednesday, July 24, 2019 - 11:00am ET
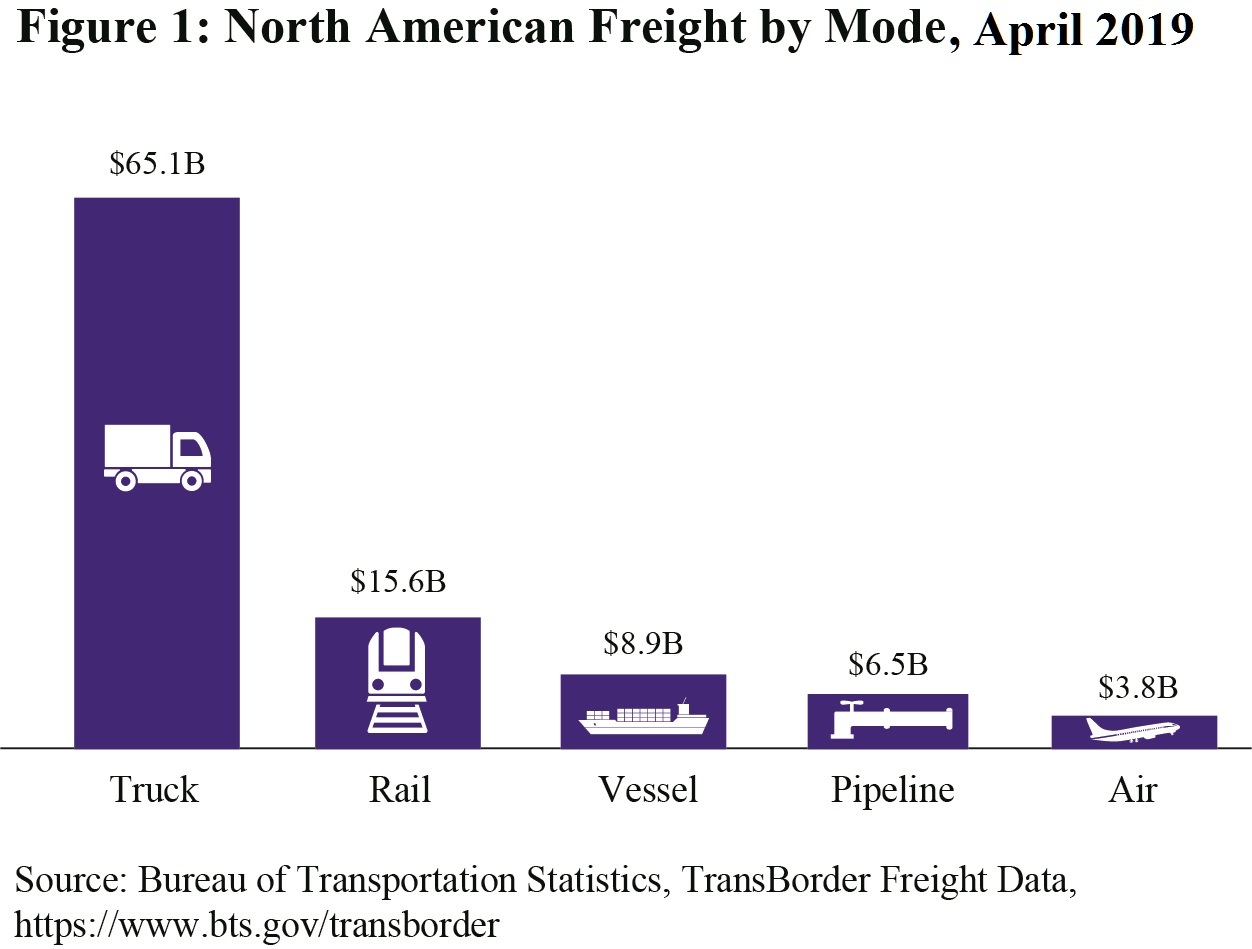
The release summarizes the value of freight transported in May by truck, rail and other modes between the U.S. and Canada and the U.S. and Mexico with the top states, ports and commodities. Previously, BTS reported that the value of total Transborder freight in April was $104.5 billion, up 1.8% compared to April 2018. Truck moved $65 billion or 62% and rail moved $16 billion or 15%.
BTS Previously
BTS has released the following:
-
Airline Fuel Cost and Consumption, May 2019
July 10
U.S. airlines May fuel cost was $2.11/gal, up 5 cents from April 2019 ($2.06) and down 8 cents from May 2018 ($2.19). Industry summary of airline fuel consumption, total fuel cost and price paid per gallon are available on the database. Individual airline numbers through March are available on the
BTS website.
-
Airline Full-Time/Part-Time Employment, May 2019
July 11
U.S. airlines May employment (738,819 total full-time and part-time)), up 0.4pct from April 2019 and up 3.3pct from May 2018 (passenger+cargo). Monthly full-time and part-time employment statistics are reported by U.S. airlines that operate at least one aircraft that has more than 60 seats or the capacity to carry a payload of passengers, cargo and fuel weighing more than 18,000 pounds.
-
Freight Transportation Services Index (TSI), May 2019
July 11
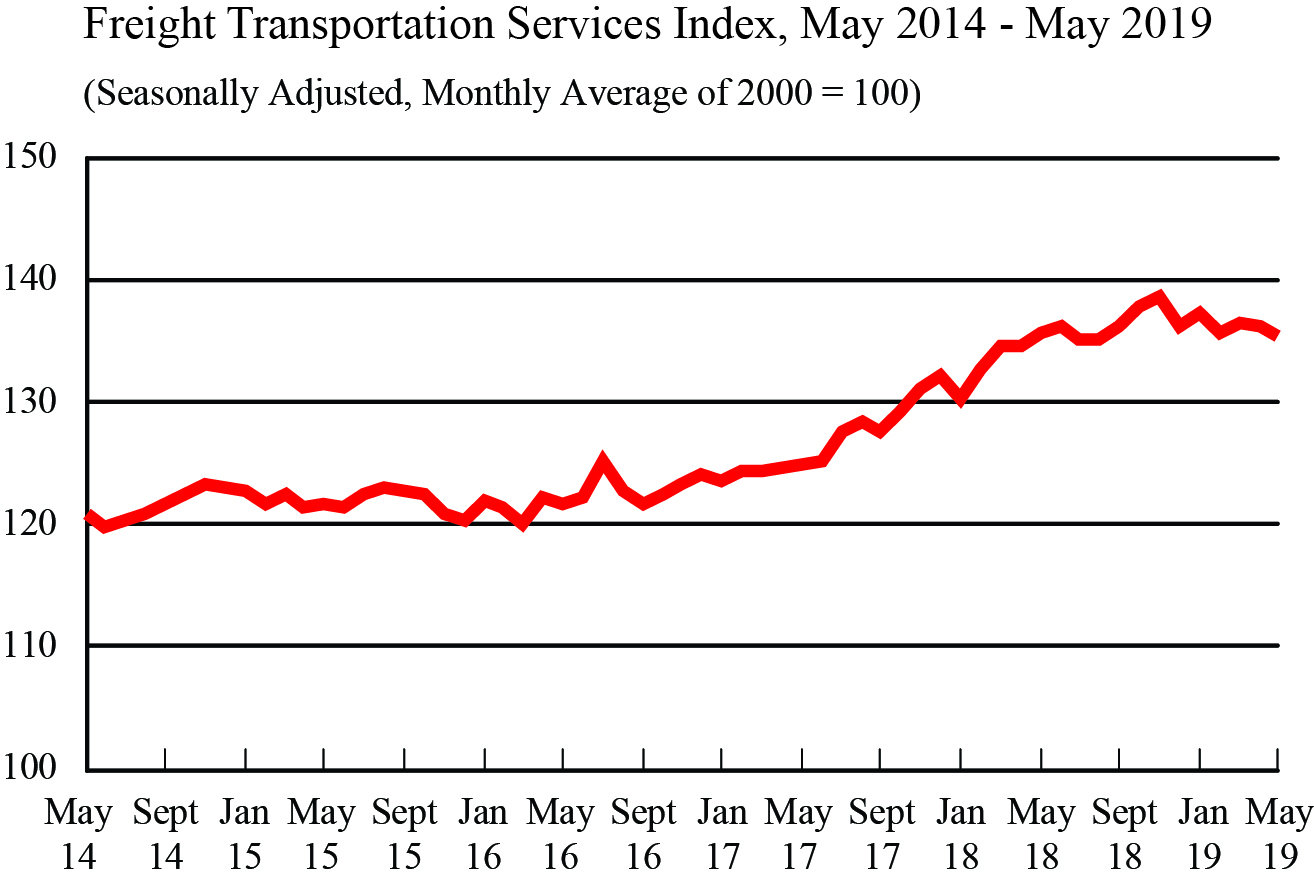
The Freight Transportation Services Index (TSI), which is based on the amount of freight carried by the for-hire transportation industry, fell 0.7% in May from April, falling for the second consecutive month. From May 2018 to May 2019, the index declined 0.2% compared to a rise of 8.6% for the previous year.
-
Airline Traffic Data, June 2019 estimate, April 2019 reported
July 12
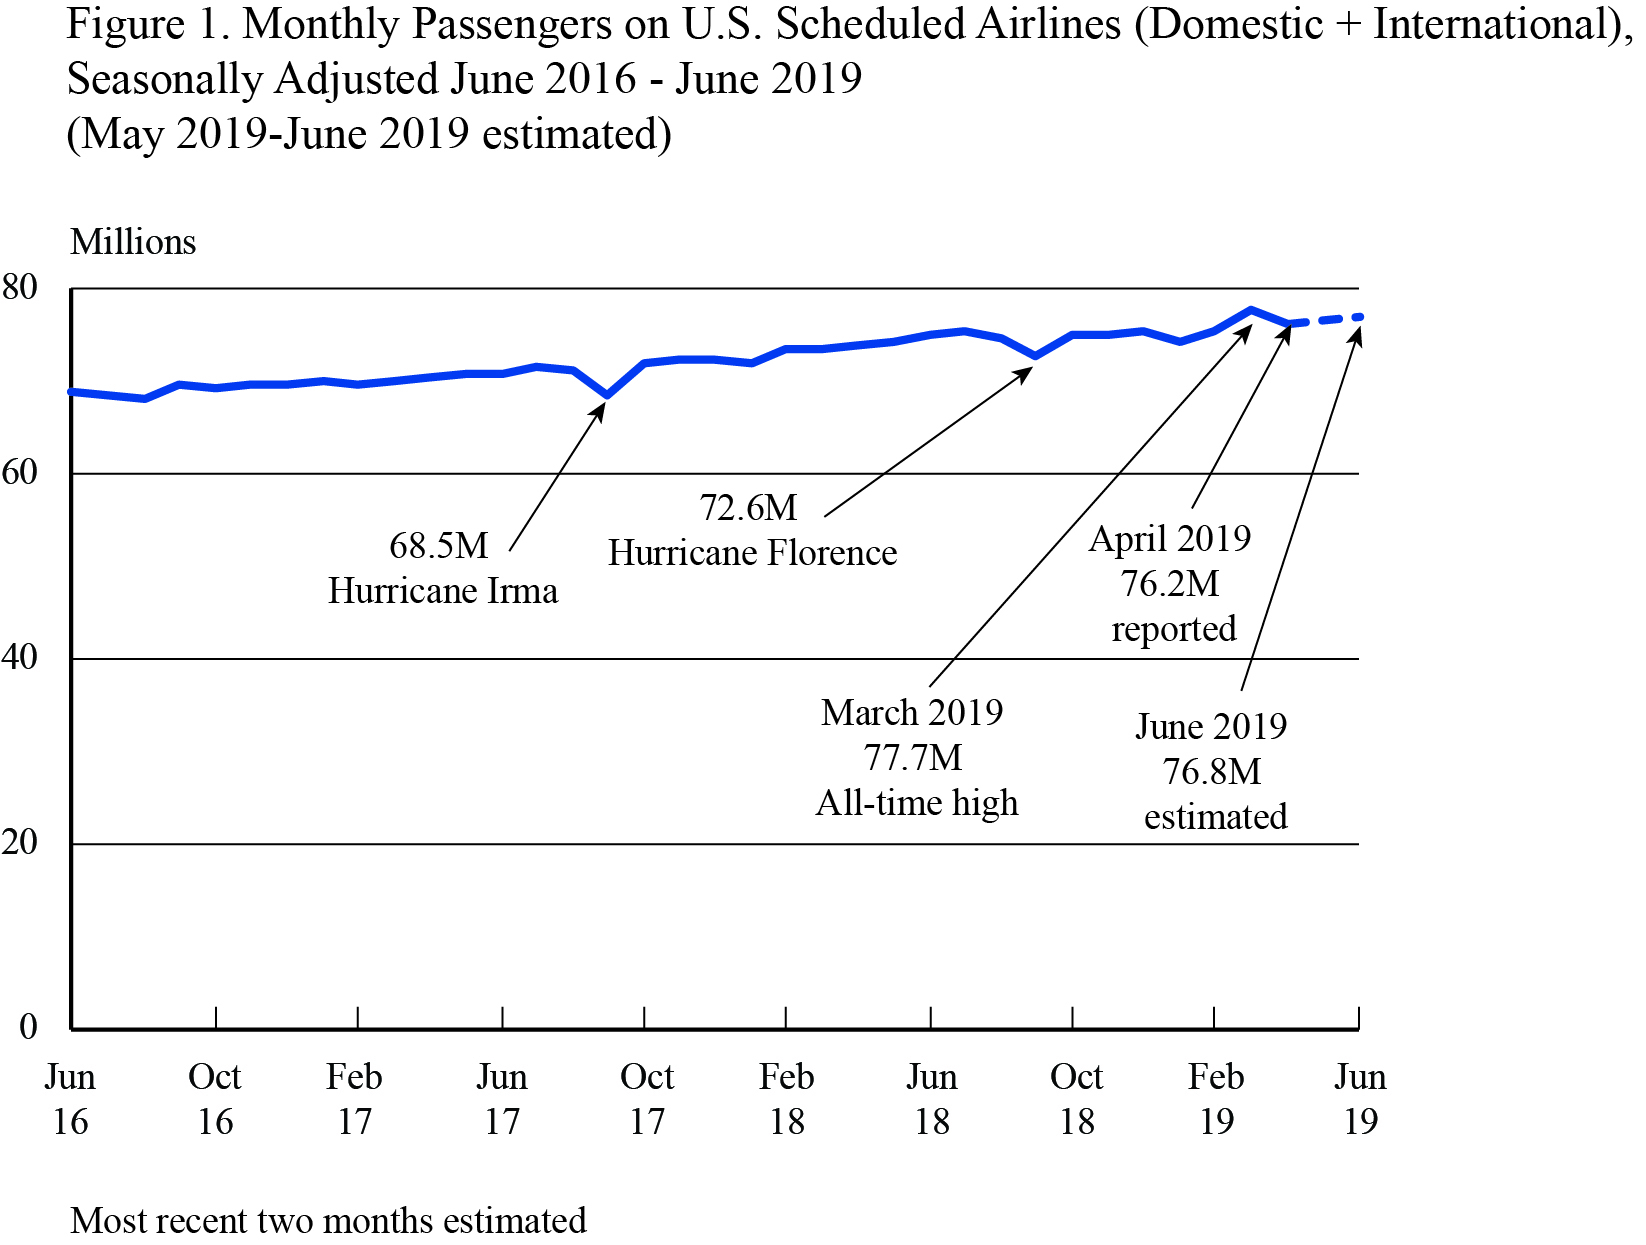
U.S. airlines carried an estimated 76.8 million systemwide (domestic and international) scheduled service passengers in June 2019, seasonally-adjusted, according to the Bureau of Transportation Statistics’ (BTS) first estimate, up 0.4% from the May second estimate. The June estimate was down 1.1% from the all-time, seasonally-adjusted, reported high of 77.7 million reached in March 2019. The air traffic estimate released is a statistical estimate based on U.S. airlines reported data through March. In unadjusted reported data for January, systemwide, domestic and international enplanements all reached all-time highs for the month of January.
-
Average Air Fares, 1st Quarter 2019
July 17
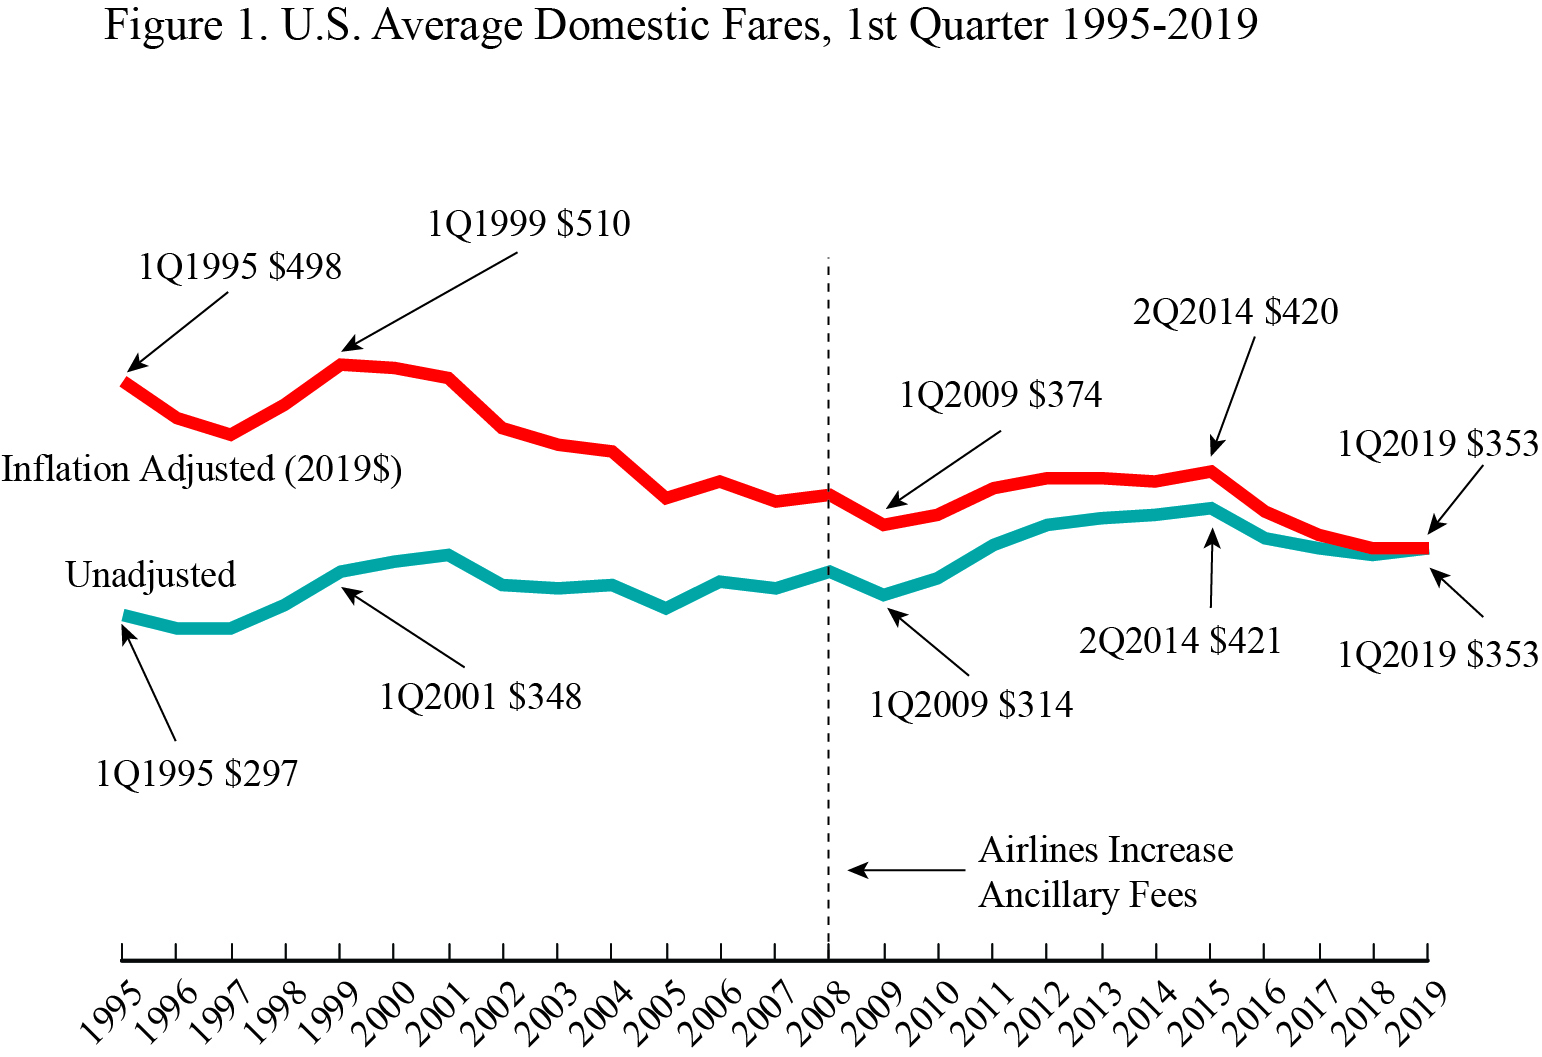
The first-quarter 2019 average domestic itinerary air fare of $353 was down 2.0% from the fourth quarter of 2018 ($361) and up 0.3% from the first quarter of 2018 ($352).
-
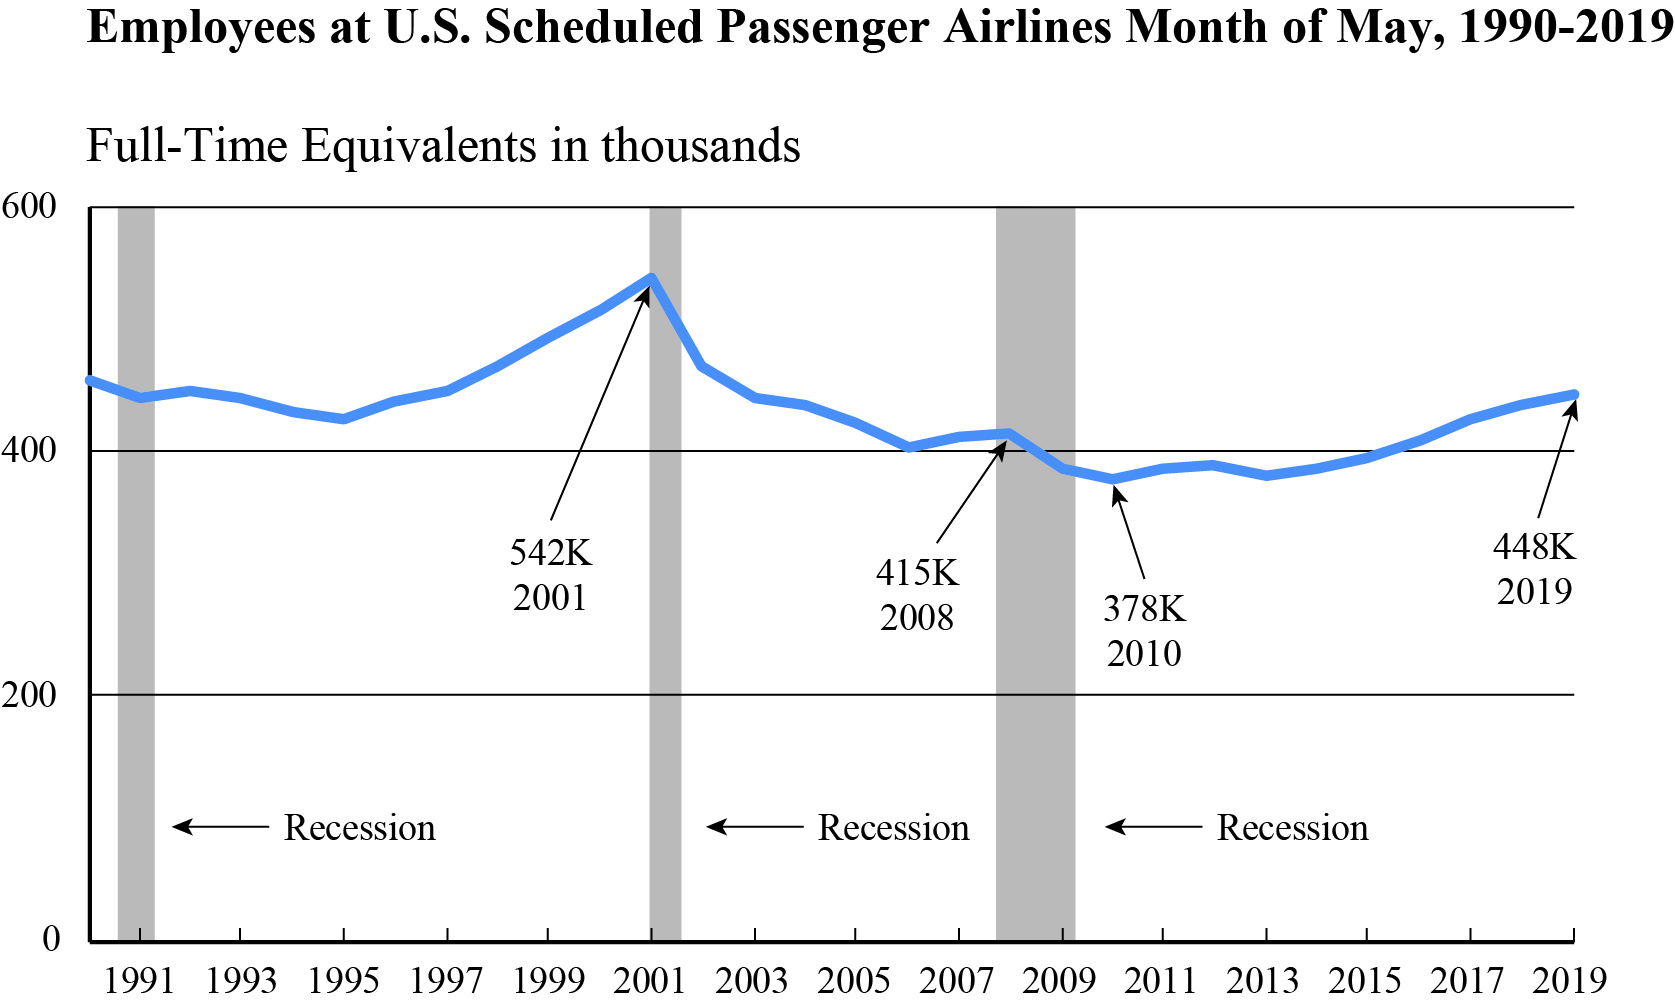
Passenger Airline Employment, May 2019
July 18
BTS reported that U.S. scheduled passenger airlines employed 2.2% more workers in May 2019 than in May 2018:
-
May’s 447,985 full-time equivalent employees (FTEs) was the highest employment total for any month since April 2003 (449,288 FTEs)
-
May was the 67th consecutive month that U.S. scheduled passenger airline FTEs exceeded the same month of the previous year.
-
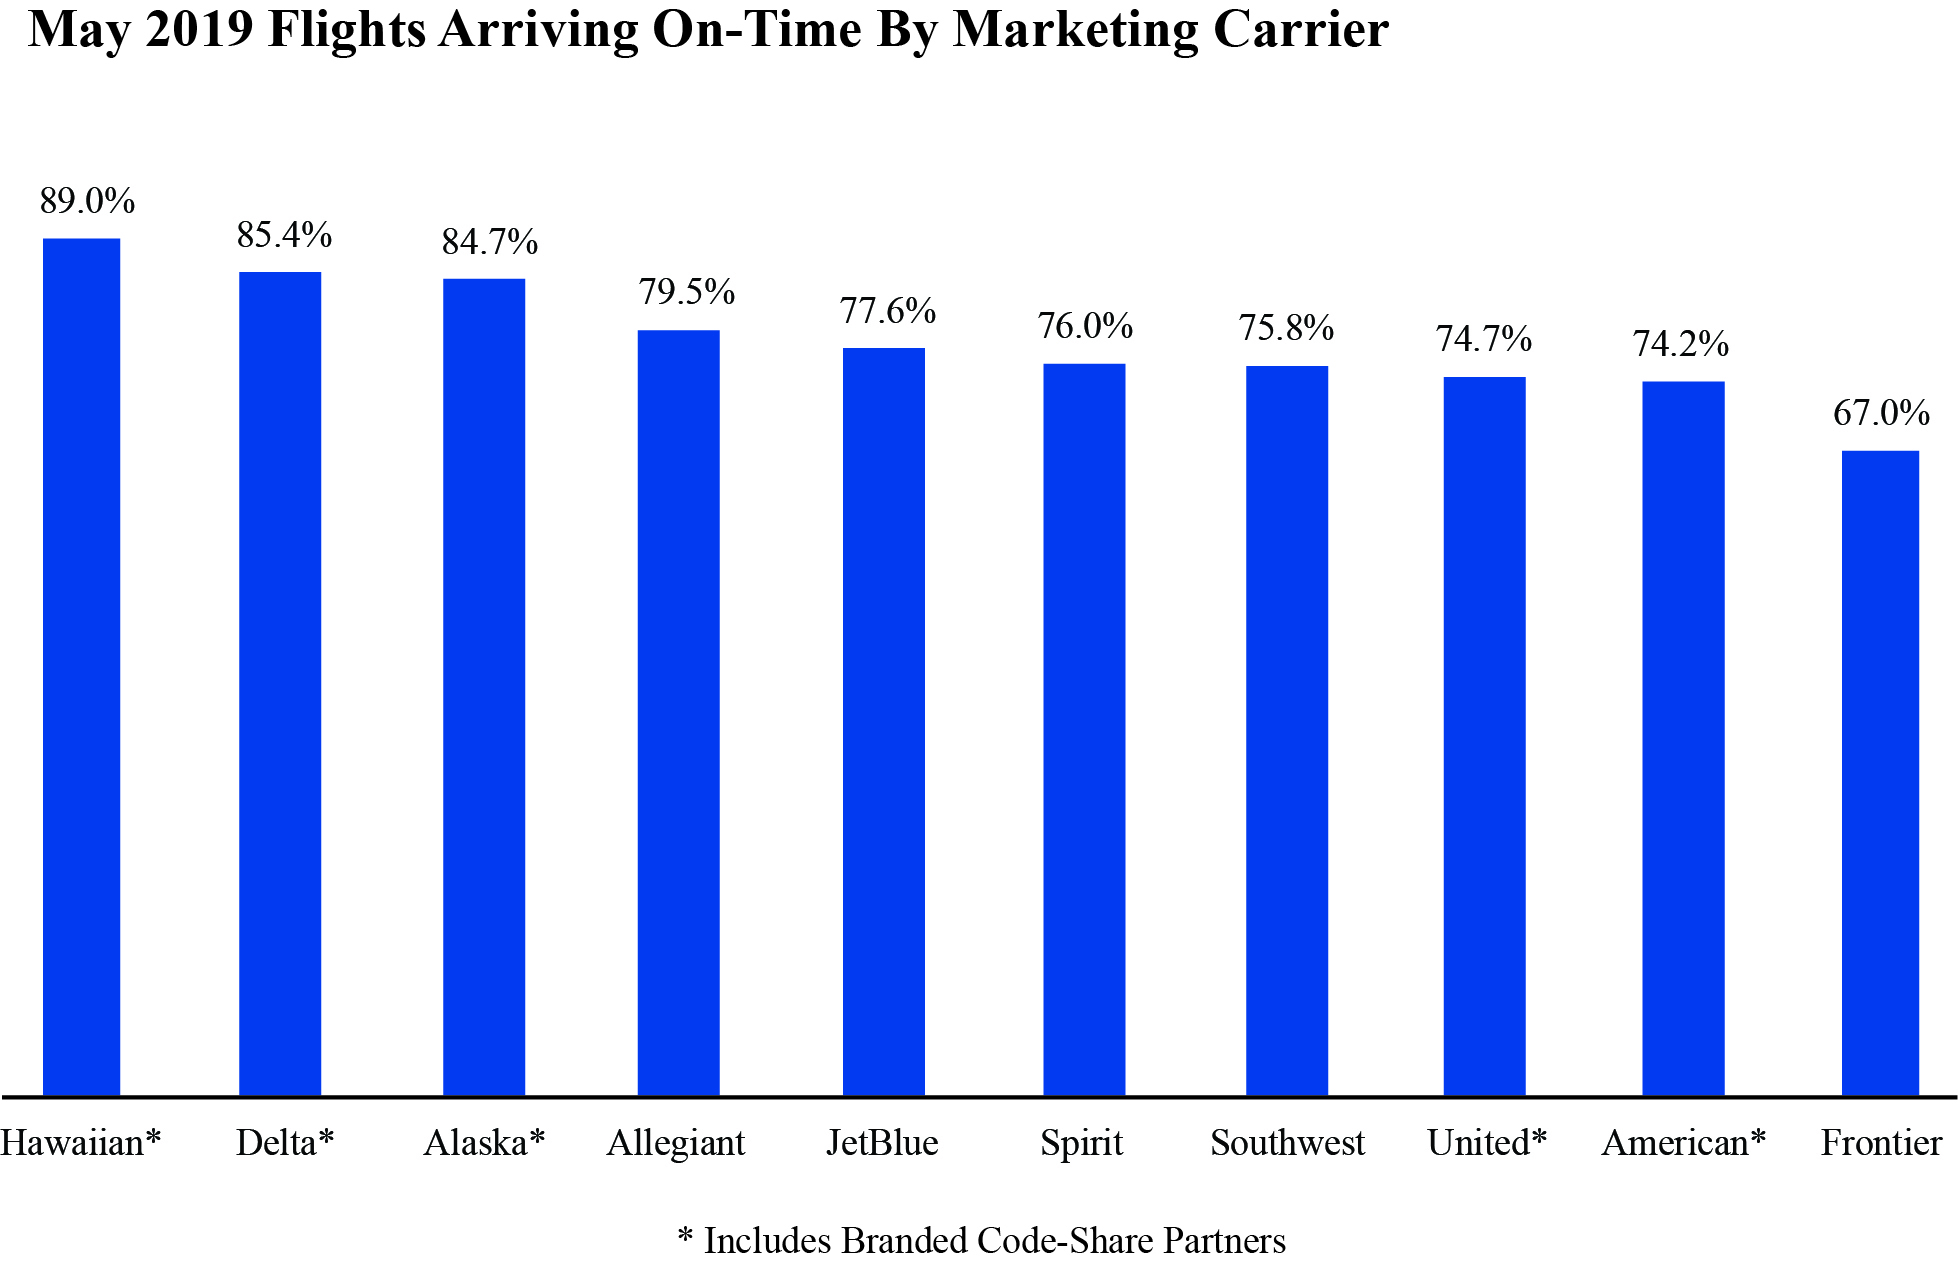
Air Travel Consumer Report: May 2019 Numbers
July 18
In May 2019, reporting marketing carriers posted an on-time arrival rate of 77.9%, down from both the 79.8% on-time rate in April 2019 and from 79.2% in May 2018. The reporting marketing carriers canceled 2.0% of their scheduled domestic flights, down from both the rate of 2.4% in April 2019 and but up from 1.3% in May 2018.
See BTS Release Schedule
BTS Contact: Dave Smallen
202-366-5568


