
First Quarter 2019 U.S. Airline Financial Data
U.S. Department of Transportation sent this bulletin at 06/17/2019 11:05 AM EDT |
|
Having trouble viewing this email? View it as a Web page.
|
First Quarter 2019 U.S. Airline Financial Data
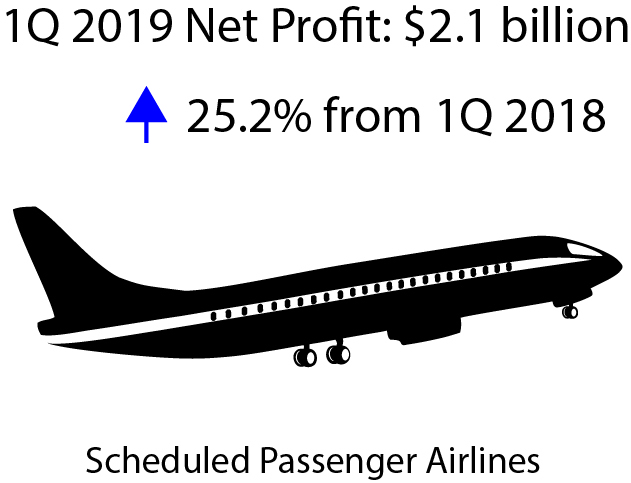
U.S. scheduled passenger airlines reported a first-quarter 2019 after-tax net profit of $2.4 billion, the 24th consecutive annual after tax profit, and a pre-tax operating profit of $3.3 billion, the 32nd consecutive quarterly pre-tax profit.
U.S. airline financial reports are filed quarterly with the Bureau of Transportation Statistics (BTS). See the tables that accompany this release on the BTS website for additional first-quarter 2019 (Tables 1-6) financial results.
Results for All 21 Scheduled U.S. Passenger Airlines:
After-tax net profit (net income)
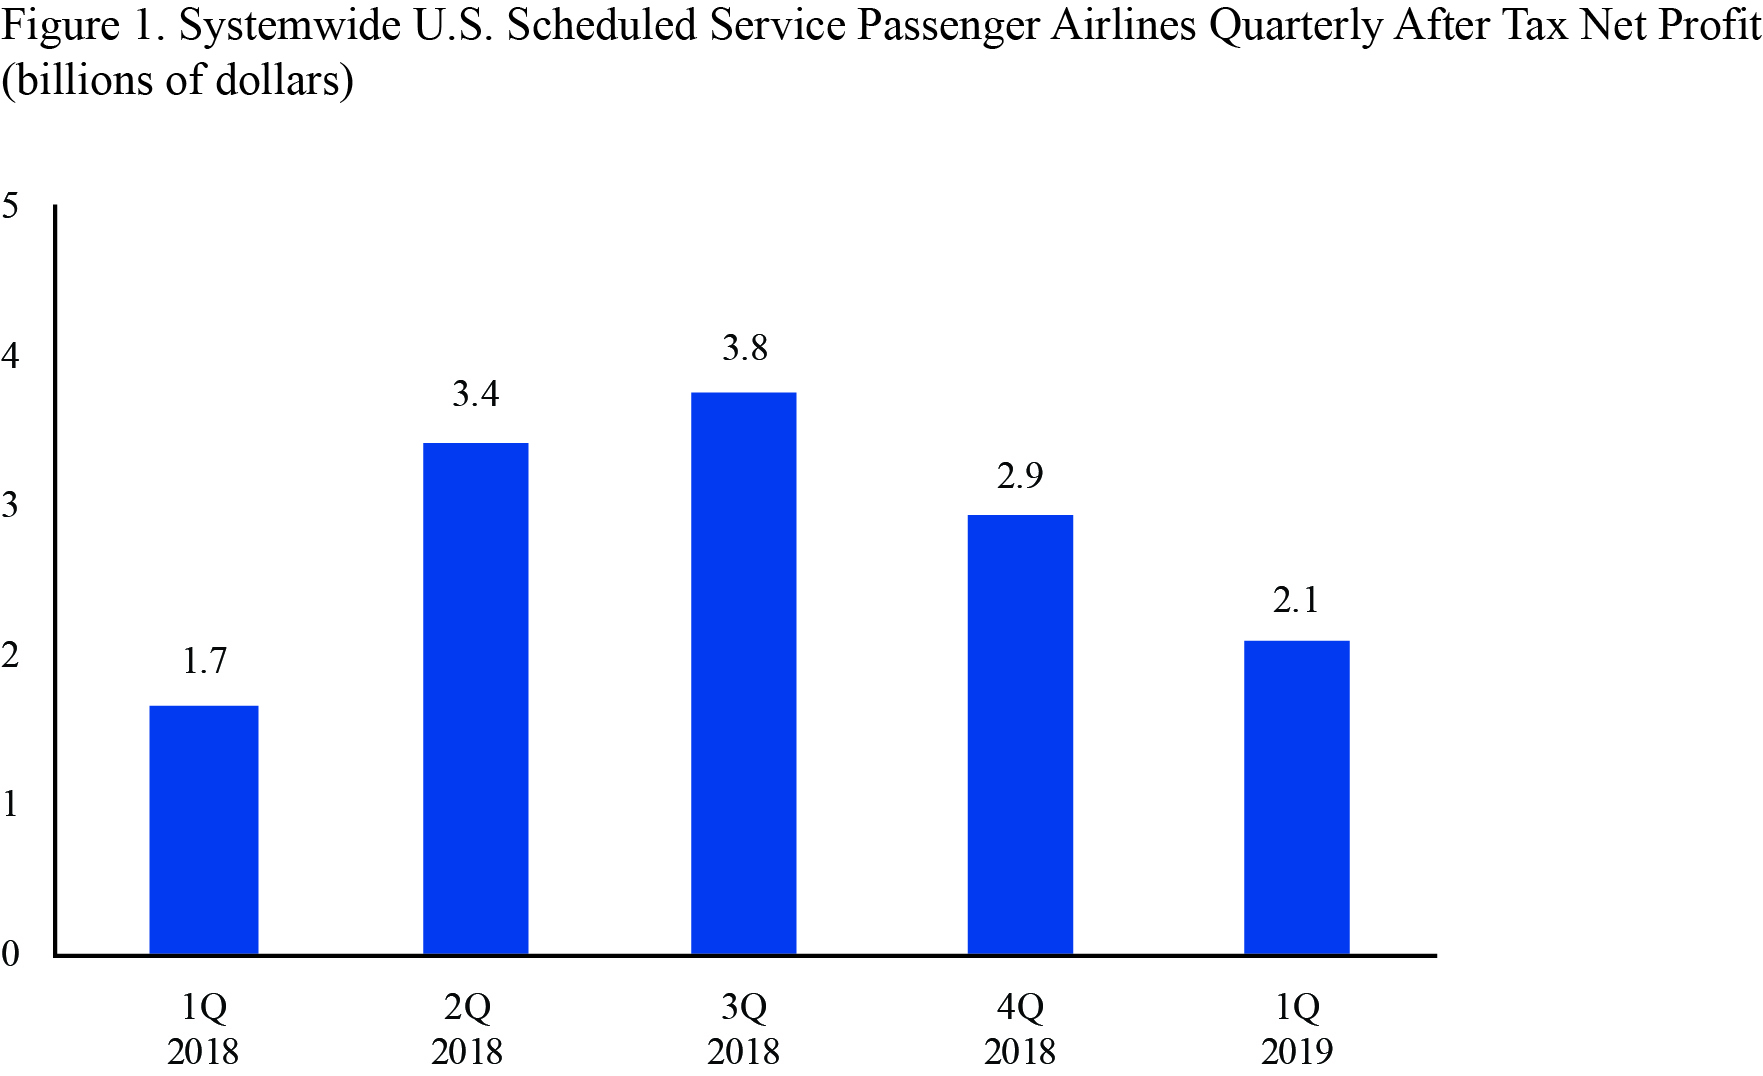
- $2.1 billion in 1Q 2019
- down from $2.9 billion in 4Q 2018
- up from $1.7 billion in 1Q 2018
Pre-tax operating profit
- $3.0 billion in 1Q 2019
- down from $3.9 billion in 4Q 2018
- up from $2.6 billion in 1Q 2018
-
Total 1Q 2019 operating revenue: $44.4 billion
- $32.5 billion from fares, 73.3% of total first-quarter operating revenue
- $1.3 billion in baggage fees, 2.9% of total operating revenue
- $662.1 million from reservation change fees, 1.5% of total operating revenue
-
Total 1Q 2019 operating expenses: $41.4 billion
- Fuel costs accounted for $7.5 billion, 18.3% of total operating expenses
- Labor costs accounted for $14.2 billion, 34.6% of total operating expenses
Fees are included for calculations of net income, operating revenue and operating profit or loss.
Domestic operations, includes 21 U.S. airlines:
After-tax domestic net profit (net income)
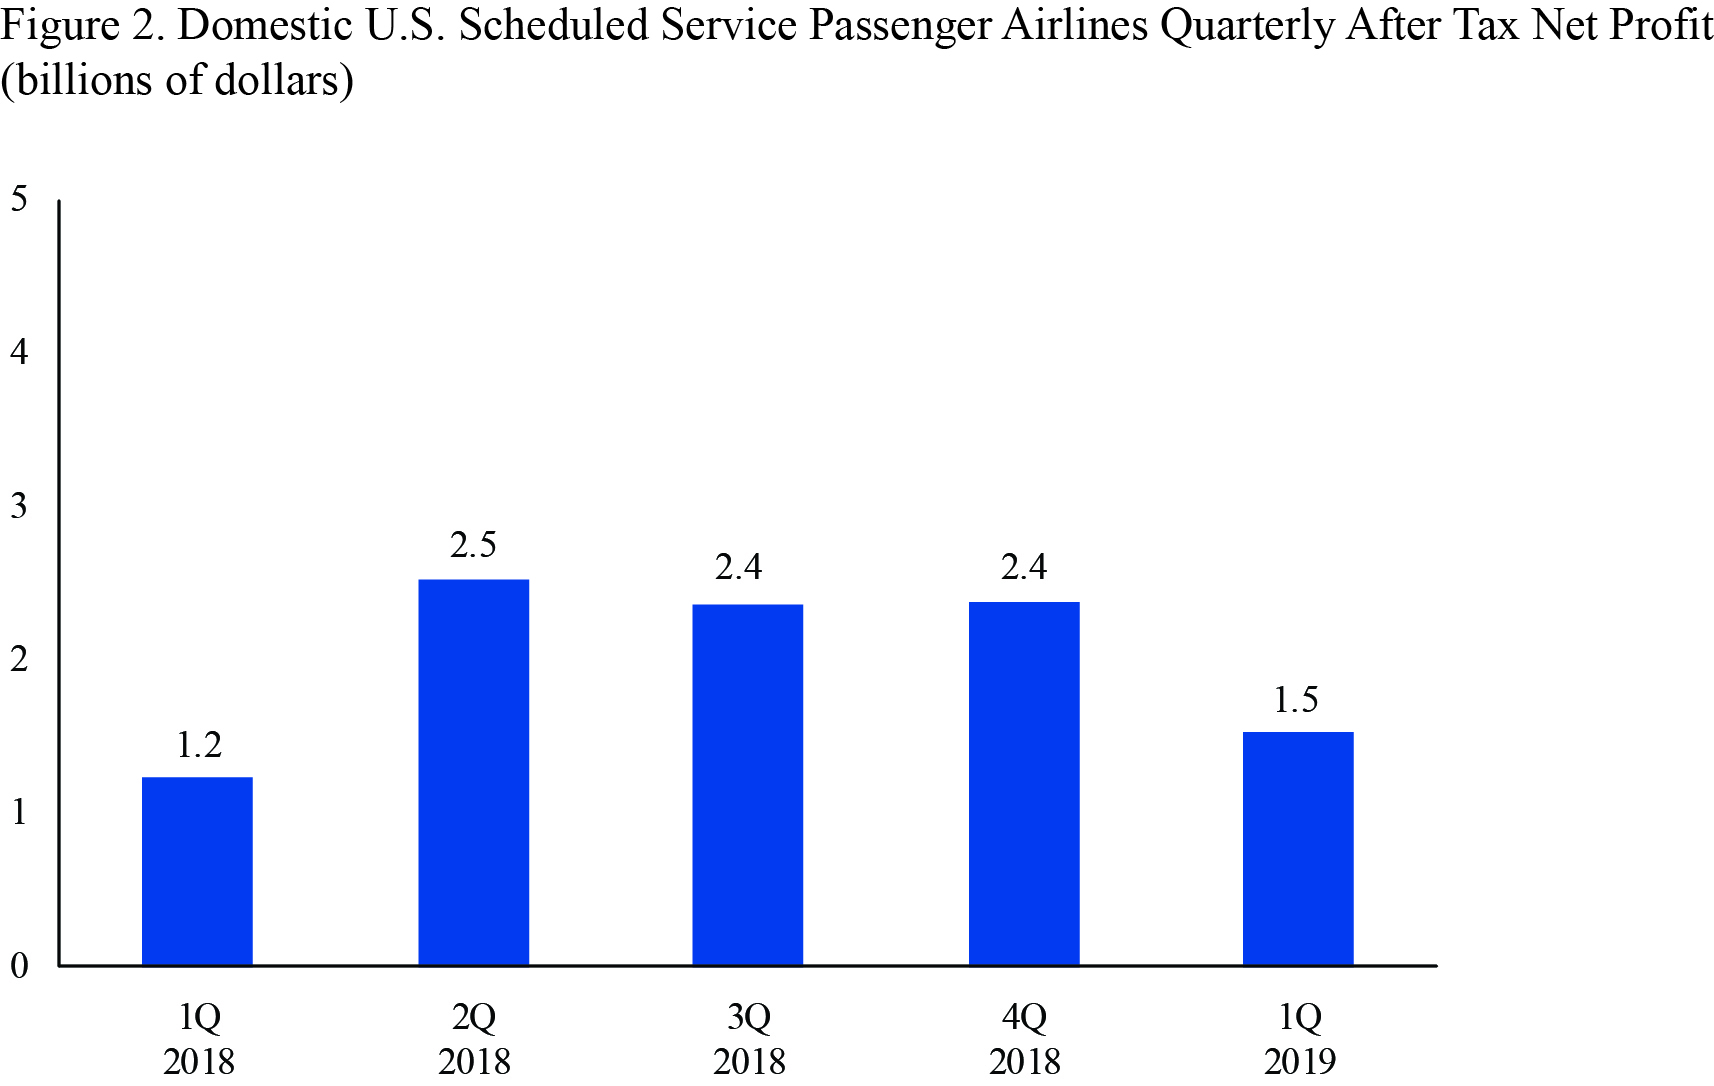
- $1.5 billion in 1Q 2019
- down from $2.4 billion in 4Q 2018
- up from $1.2 billion in 1Q 2018
Pre-tax domestic operating profit
- $2.2 billion in 1Q 2019
- down from $3.2 billion in 4Q 2018
- up from $2.0 billion in 1Q 2018
-
Total 1Q 2019 domestic operating revenue: $33.7 billion
- $23.8 billion from fares, 70.7% of total first-quarter domestic operating revenue
- $957.4 million in baggage fees, 2.8% of total domestic operating revenue
- $464.8 million from reservation change fees, 1.4% of total domestic operating revenue
-
Total 1Q 2019 domestic operating expenses: $31.5 billion
- Fuel costs accounted for $5.2 billion, 16.5% of total domestic operating expenses
- Labor costs accounted for $10.5 billion, 33.5% of total domestic operating expenses
International operations, includes 18 U.S. airlines:
After-tax international net profit (net income)
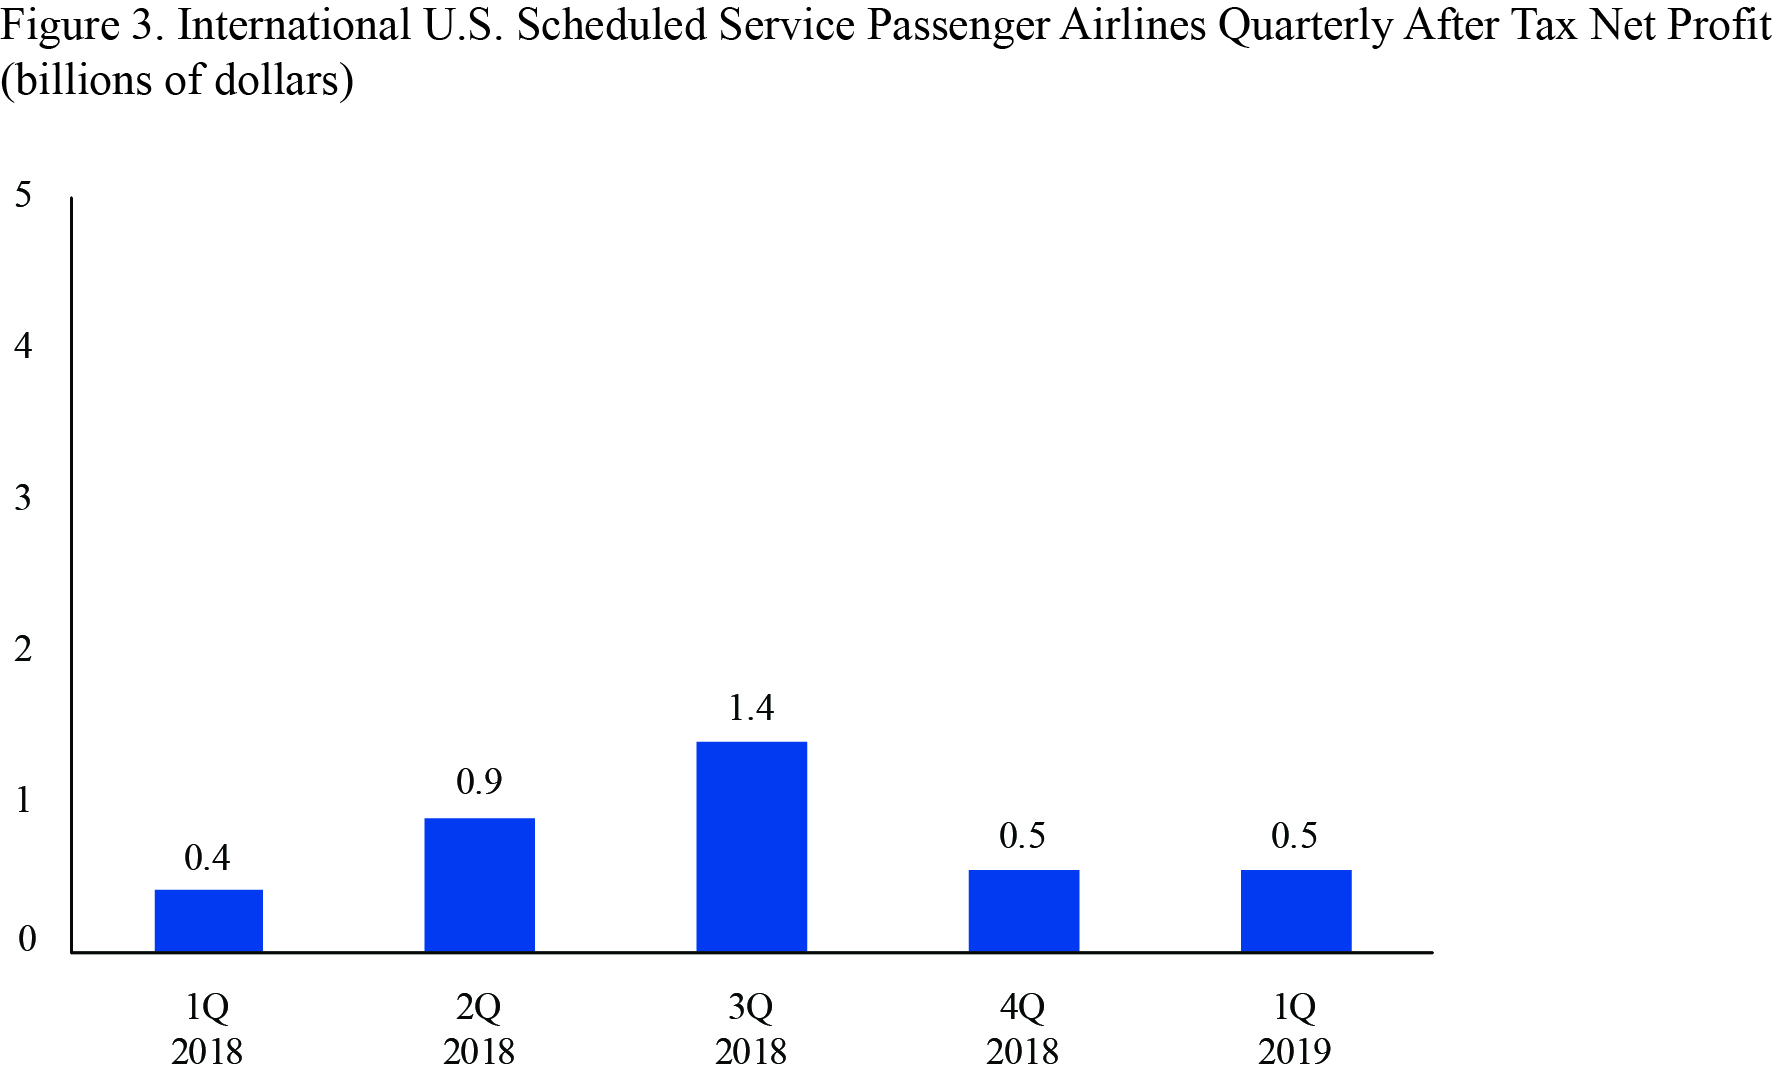
- $546 million in 1Q 2019
- up from $546 million in 4Q 2018
- up from $425 million in 1Q 2018
Pre-tax international operating profit
- $747 million in 1Q 2018
- up from $703 million in 4Q 2018
- up from $611 million in 1Q 2018
-
Total 1Q 2019 international operating revenue: $10.7 billion
- $8.7 billion from fares, 81.6% of first-quarter international operating revenue
- $334 million in baggage fees, 3.1% of international operating revenue
- $197 million from reservation change fees, 1.8% of international operating revenue
-
Total 1Q 2019 international operating expenses: $10.0 billion,
- Fuel costs accounted for $2.3 billion, 24.3% of international operating expenses
- Labor costs accounted for $3.7 billion, 38.1% of international operating expenses
1st Quarter Margins
Net margin is the net income or loss as a percentage of operating revenue. Operating margin is the operating profit or loss as a percentage of operating revenue.
- 7% in 1Q2019
- up from 3.9% in 1Q 2018
Operating margin:
- 6% in 1Q2019
- up from 6.1% in 1Q 2018
- 6% in 1Q2019
- up from 3.9% in 1Q 2018
Operating margin:
- 5% in 1Q2019
- up from 6.3% in 1Q 2018
- 1% in 1Q2019
- up from 4.0% in 1Q 2018
Operating margin:
- 0% in 1Q2019
- up from 5.8% in 1Q 2018
Reporting notes
Additional data: BTS website, See tables for operating profit/loss, operating revenue and fuel cost and consumption. See the BTS financial databases for more detailed data including numbers for individual airlines.
Filing requirement: By regulation, for the quarter ending March 31, airlines that operate at least one aircraft that is designed/certified for more than 60 seats or the capacity to carry a payload of passengers and cargo weighing more than 18,000 pounds must report financial data to BTS by May 10. The airline filings are subject to a process of quality assurance and data validations before release to the public.
Data updates: Revised carrier data and late data filings will be made available monthly on TranStats on the Monday following the second Tuesday of the month. All data are subject to revision. BTS will release 2nd-quarter 2019 data on Sept. 16.
|
You are subscribed to DOT email updates. Subscriber Services: Manage Preferences |
|
||||||||||||
