BTS 2-Week Outlook
Bureau of Transportation Statistics Upcoming Releases
April 29 through May 10
Upcoming from April 29
Wednesday, May 1, 2019 - 11:00am ET
North American Freight Data, February 2019
Monday, May 6, 2019 - 11:00am ET
Airline Financial Data, 4th Quarter 2018
Tuesday, May 7, 2019 - 11:00am ET
Airline Fuel Cost and Consumption, March 2019
Wednesday, May 8, 2019 - 11:30am ET
Transportation Services Index, March 2019
Thursday, May 9, 2019 - 11:00am ET
Airline Full-Time/Part-Time Employment, March 2019
Previously Released
April 15 – U.S. Passenger Airline Employment, February 2019
April 16 – Domestic Average Air Fares, Annual and Fourth Quarter 2018
April 18 – Airline On-Time/Tarmac Data, February 2019
April 19 -- National Transportation Atlas Database Spring 2019 Update
The Bureau of Transportation Statistics will release the following data sets in the next two weeks:
-
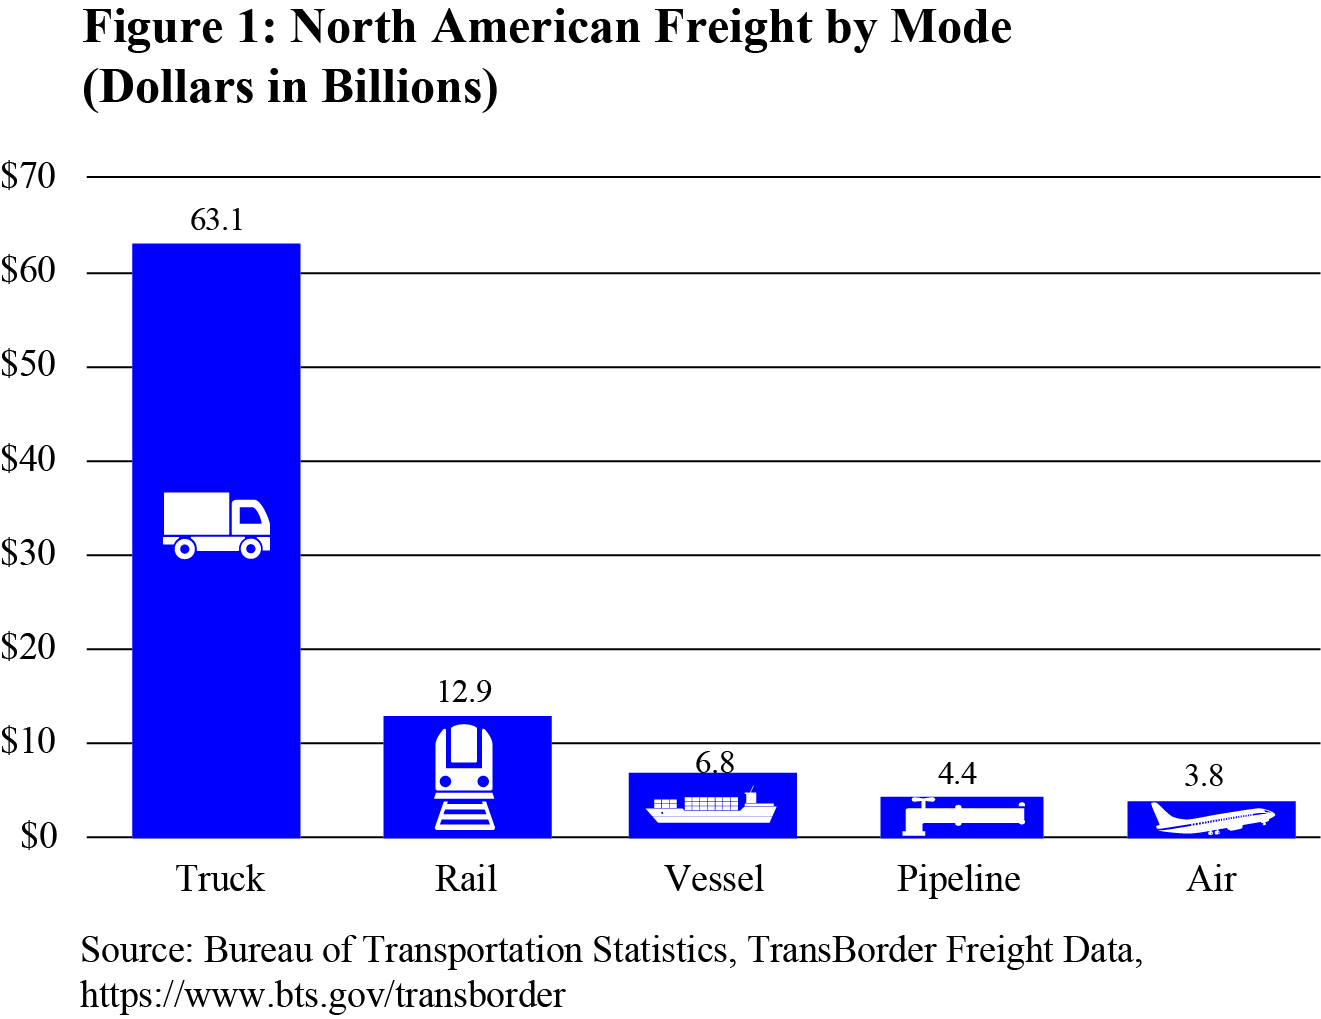
North American Transborder Freight Data, February 2019
Wednesday, May 1, 2019 - 11:00am ET
The release summarizes the value of freight transported in February by truck, rail and other modes between the U.S. and Canada and the U.S. and Mexico with the top states, ports and commodities. Previously, BTS reported that the top two modes in January for those freight movements were truck and rail. Trucks moved freight valued at $63.1 billion, up 4.1% compared to January 2018. Rail moved freight valued at $12.9 billion, up 3.0% during the same period.
-
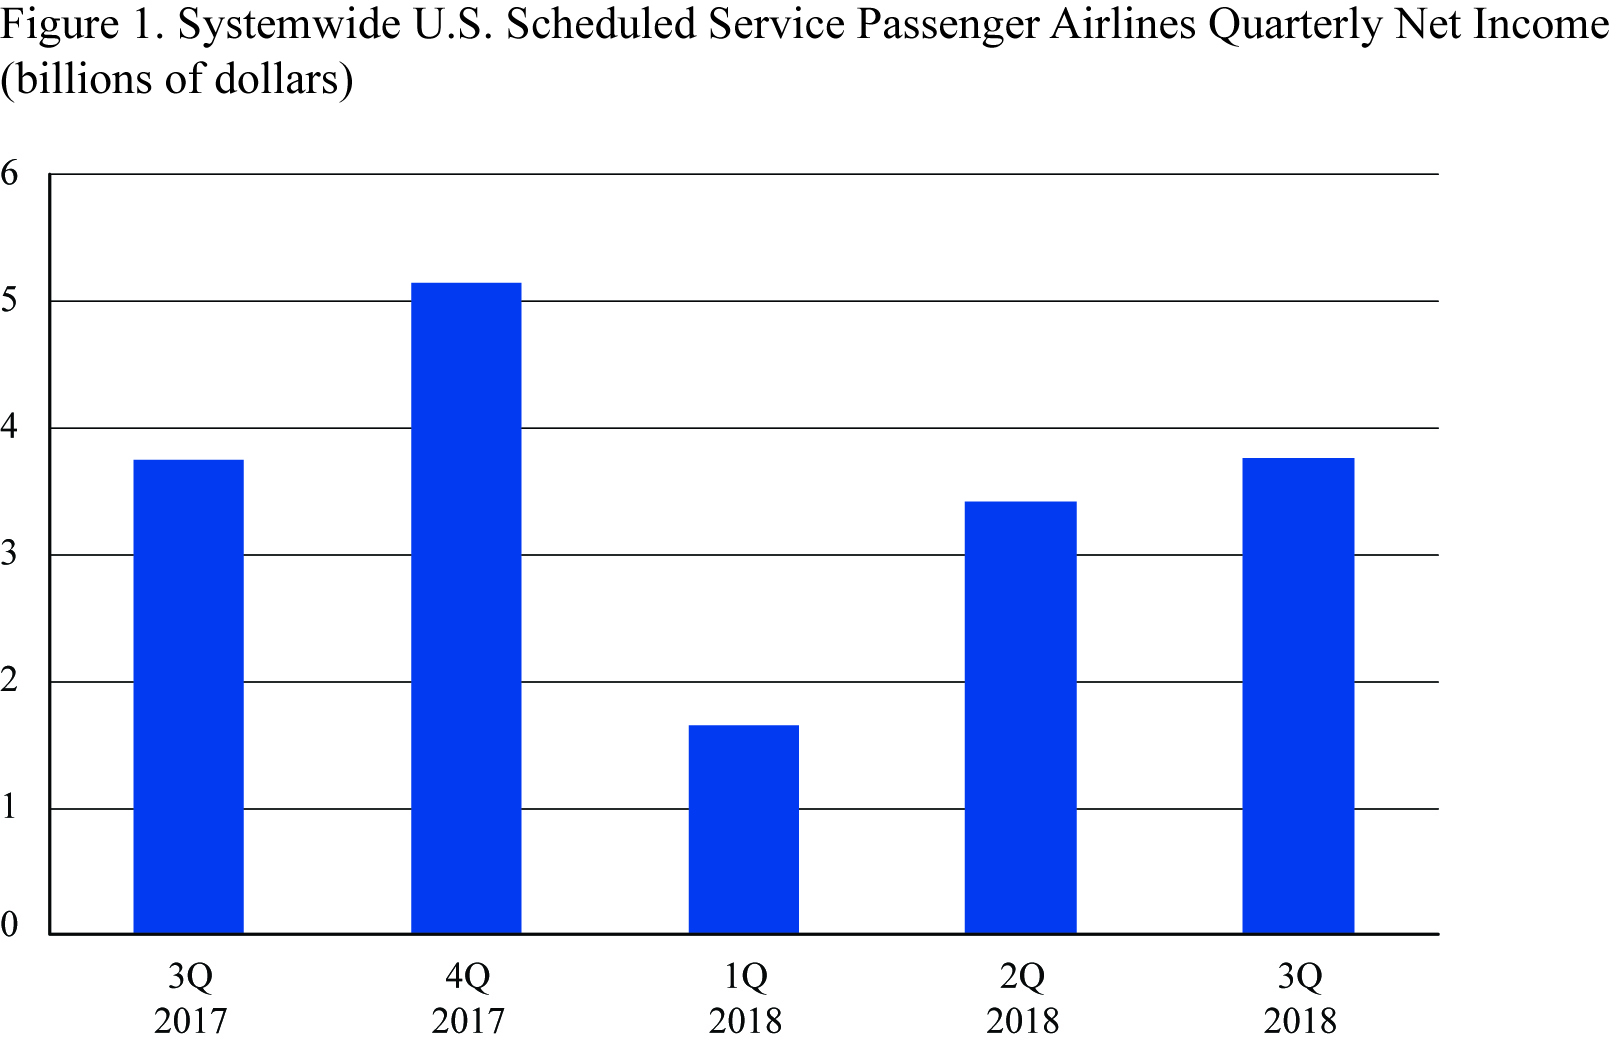
U.S. Airline Financial Data, Annual and 4th Quarter 2018
Monday, May 6, 2019 - 11:00am ET
The release summarizes annual and quarterly net profit, operating profit, operating revenue and operating expenses for the U.S. scheduled service passenger airlines for systemwide, domestic and international operations. The BTS third quarter release said that U.S. scheduled passenger airlines reported an after-tax net profit of $3.8 billion in the second quarter of 2018, up from $3.4 billion in the second quarter of 2018 and up from $3.7 billion in the third quarter of 2017. Additional financial numbers for all airlines will be available on the BTS financial databases.
-
Airline Fuel Cost and Consumption, March 2019
Tuesday, May 7, 2019 - 11:00am ET
U.S. airlines February fuel cost was $1.98 per gallon, up 7 cents from January ($1.91) and down 5 cents from February 2018 ($2.03). Industry summary of airline fuel consumption, total fuel cost and price paid per gallon are available on the database. Individual airline numbers will be available on the BTS website.
-
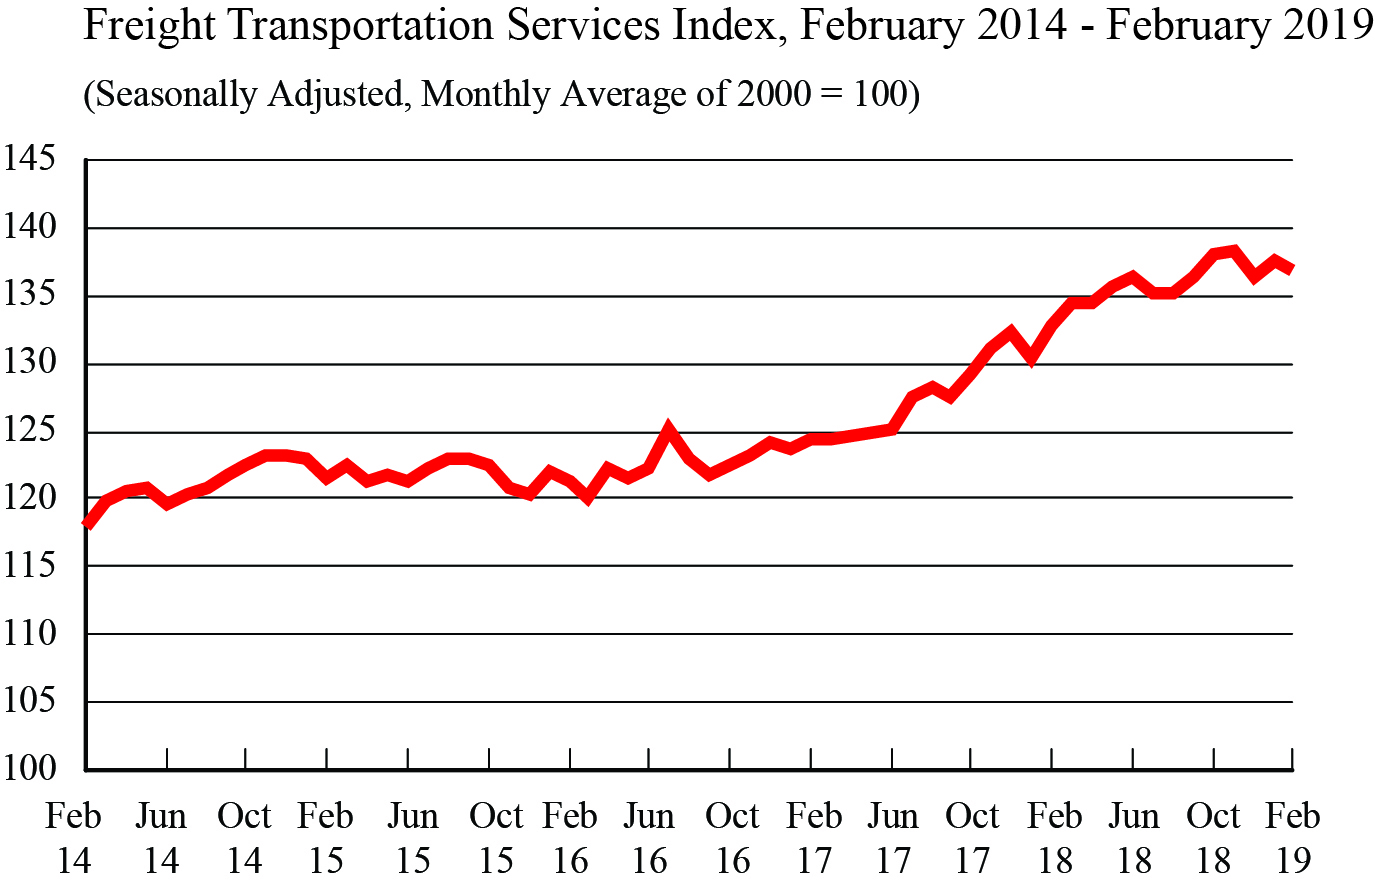
Transportation Services Index (TSI), March 2019
Wednesday, May 8, 2019 - 11:30am ET
The Freight TSI measures the month-to-month changes in for-hire freight shipments by mode of transportation. The Passenger TSI measures the month-to-month changes in travel that involves the services of the for-hire passenger transportation sector. In the previous release for February, BTS reported that the Freight TSI fell 0.5% in February from January, falling after a one month increase. For the 12 months ending in February 2019, the index rose 3.2% compared to 6.7% for the previous 12-month period.
-
Airline Full-Time/Part-Time Employment, March 2019
Thursday, May 9, 2019 - 11:00am ET
U.S. airlines February employment (731,805 total full-time and part-time)) was up 0.1% from January and up 3.5% from February 2018 (passenger+cargo). Monthly full-time and part-time employment statistics are reported by U.S. airlines that operate at least one aircraft that has more than 60 seats or the capacity to carry a payload of passengers, cargo and fuel weighing more than 18,000 pounds.
BTS Previously
BTS has released the following:
-
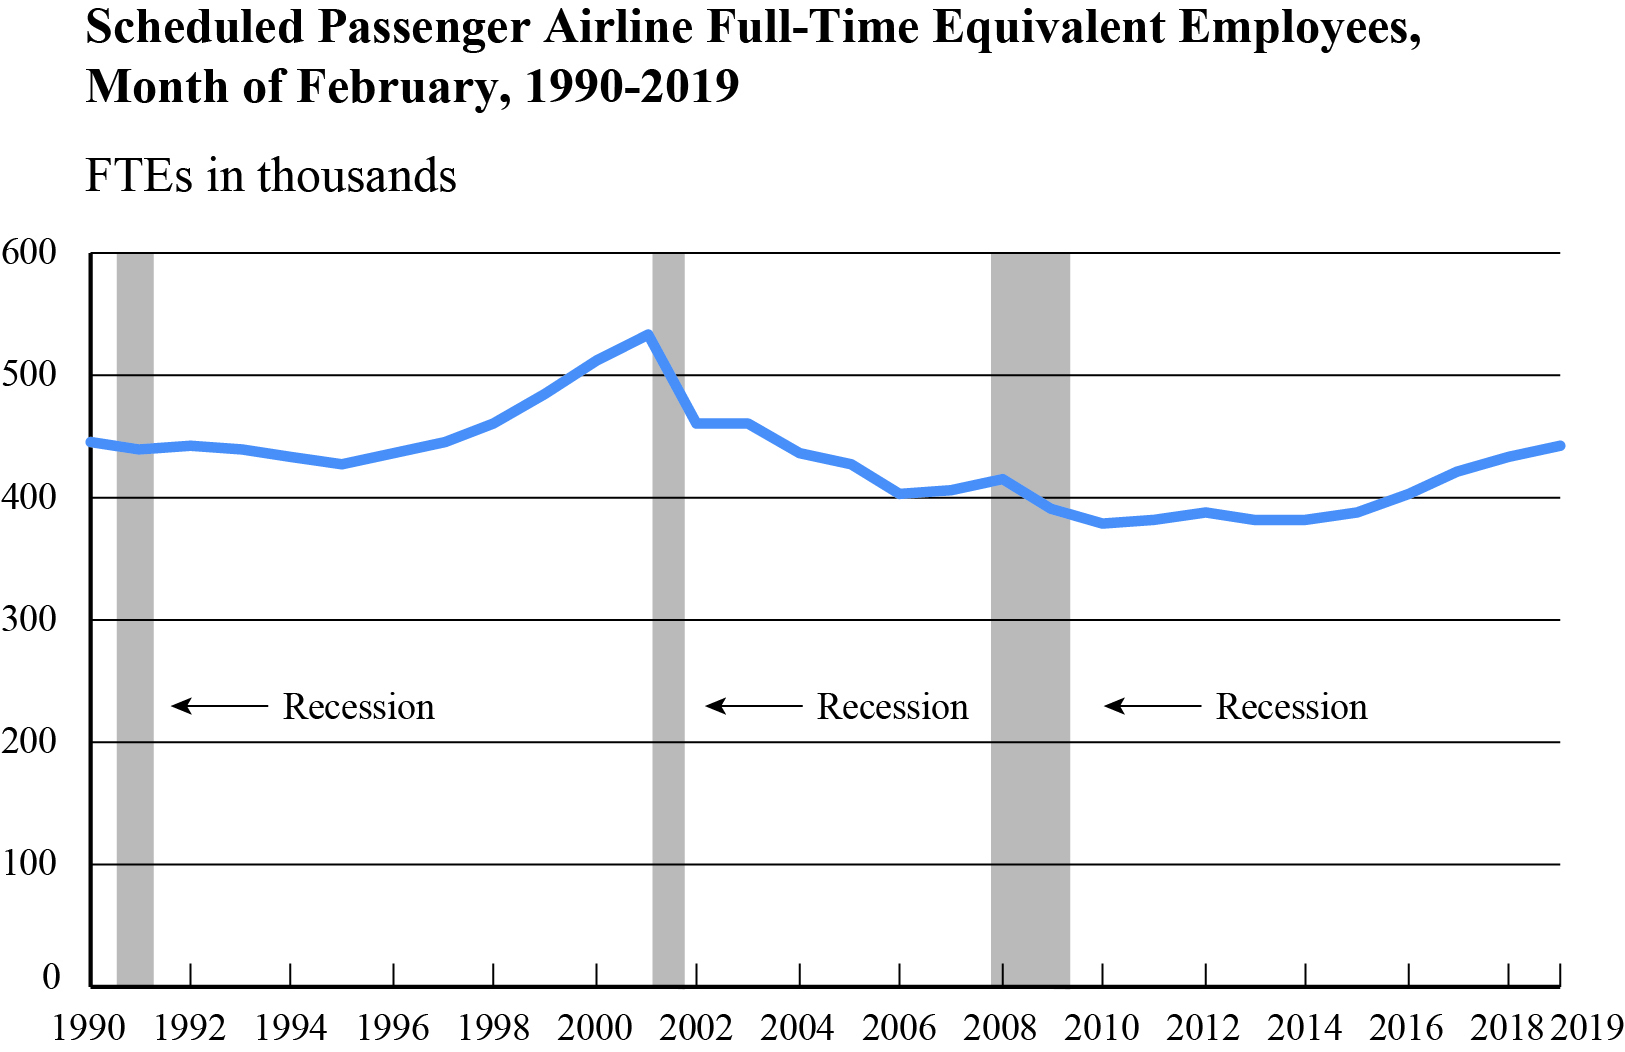
Passenger Airline Employment, February 2019
April 15
BTS reported that U.S. scheduled passenger airlines employed 2.5% more workers in February 2019 than in February 2018:
-
February’s 443,058 full-time equivalent employees (FTEs) was the highest February employment total since February 2003 (460,852 FTEs).
-
February was the 64th consecutive month that U.S. scheduled passenger airline FTEs exceeded the same month of the previous year.
-
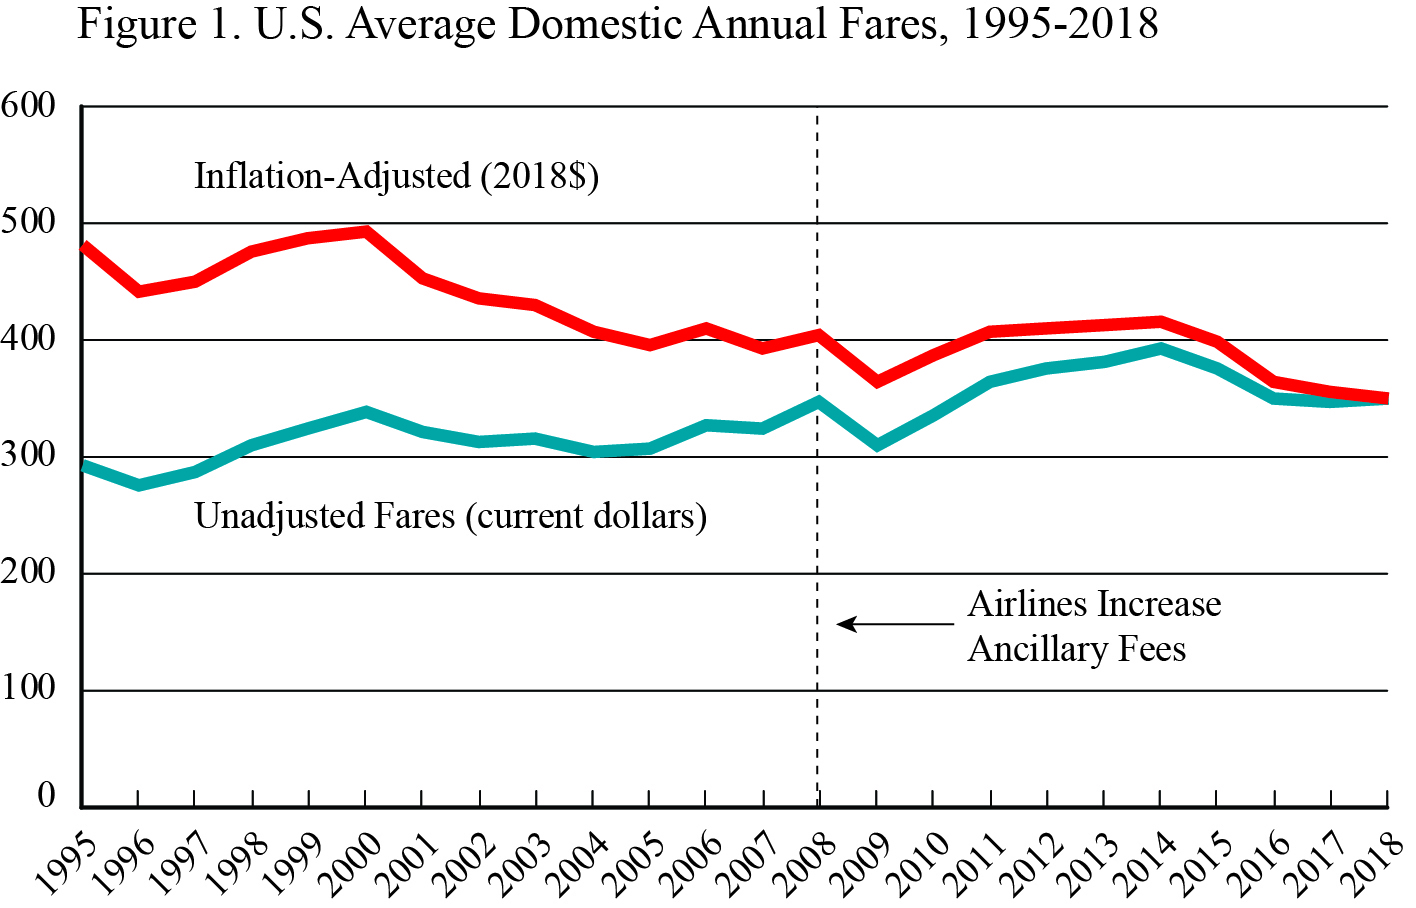
Average Air Fares, Annual and 4th 2018
April 16
The 2018 average domestic itinerary air fare of $350 was the lowest inflation-adjusted annual fare since BTS began collecting such records in 1995, down 1.8% from the previous low of $356 in 2017. In the fourth quarter of the year, fares turned up to $359, reaching the highest quarterly level since the second quarter of 2017 ($367). The fourth-quarter 2018 average domestic itinerary air fare was up 4.7% from in the third quarter of 2018 ($343), which was the lowest quarter on record, adjusted for inflation, and up 1.2% from the fourth quarter of 2017.
-
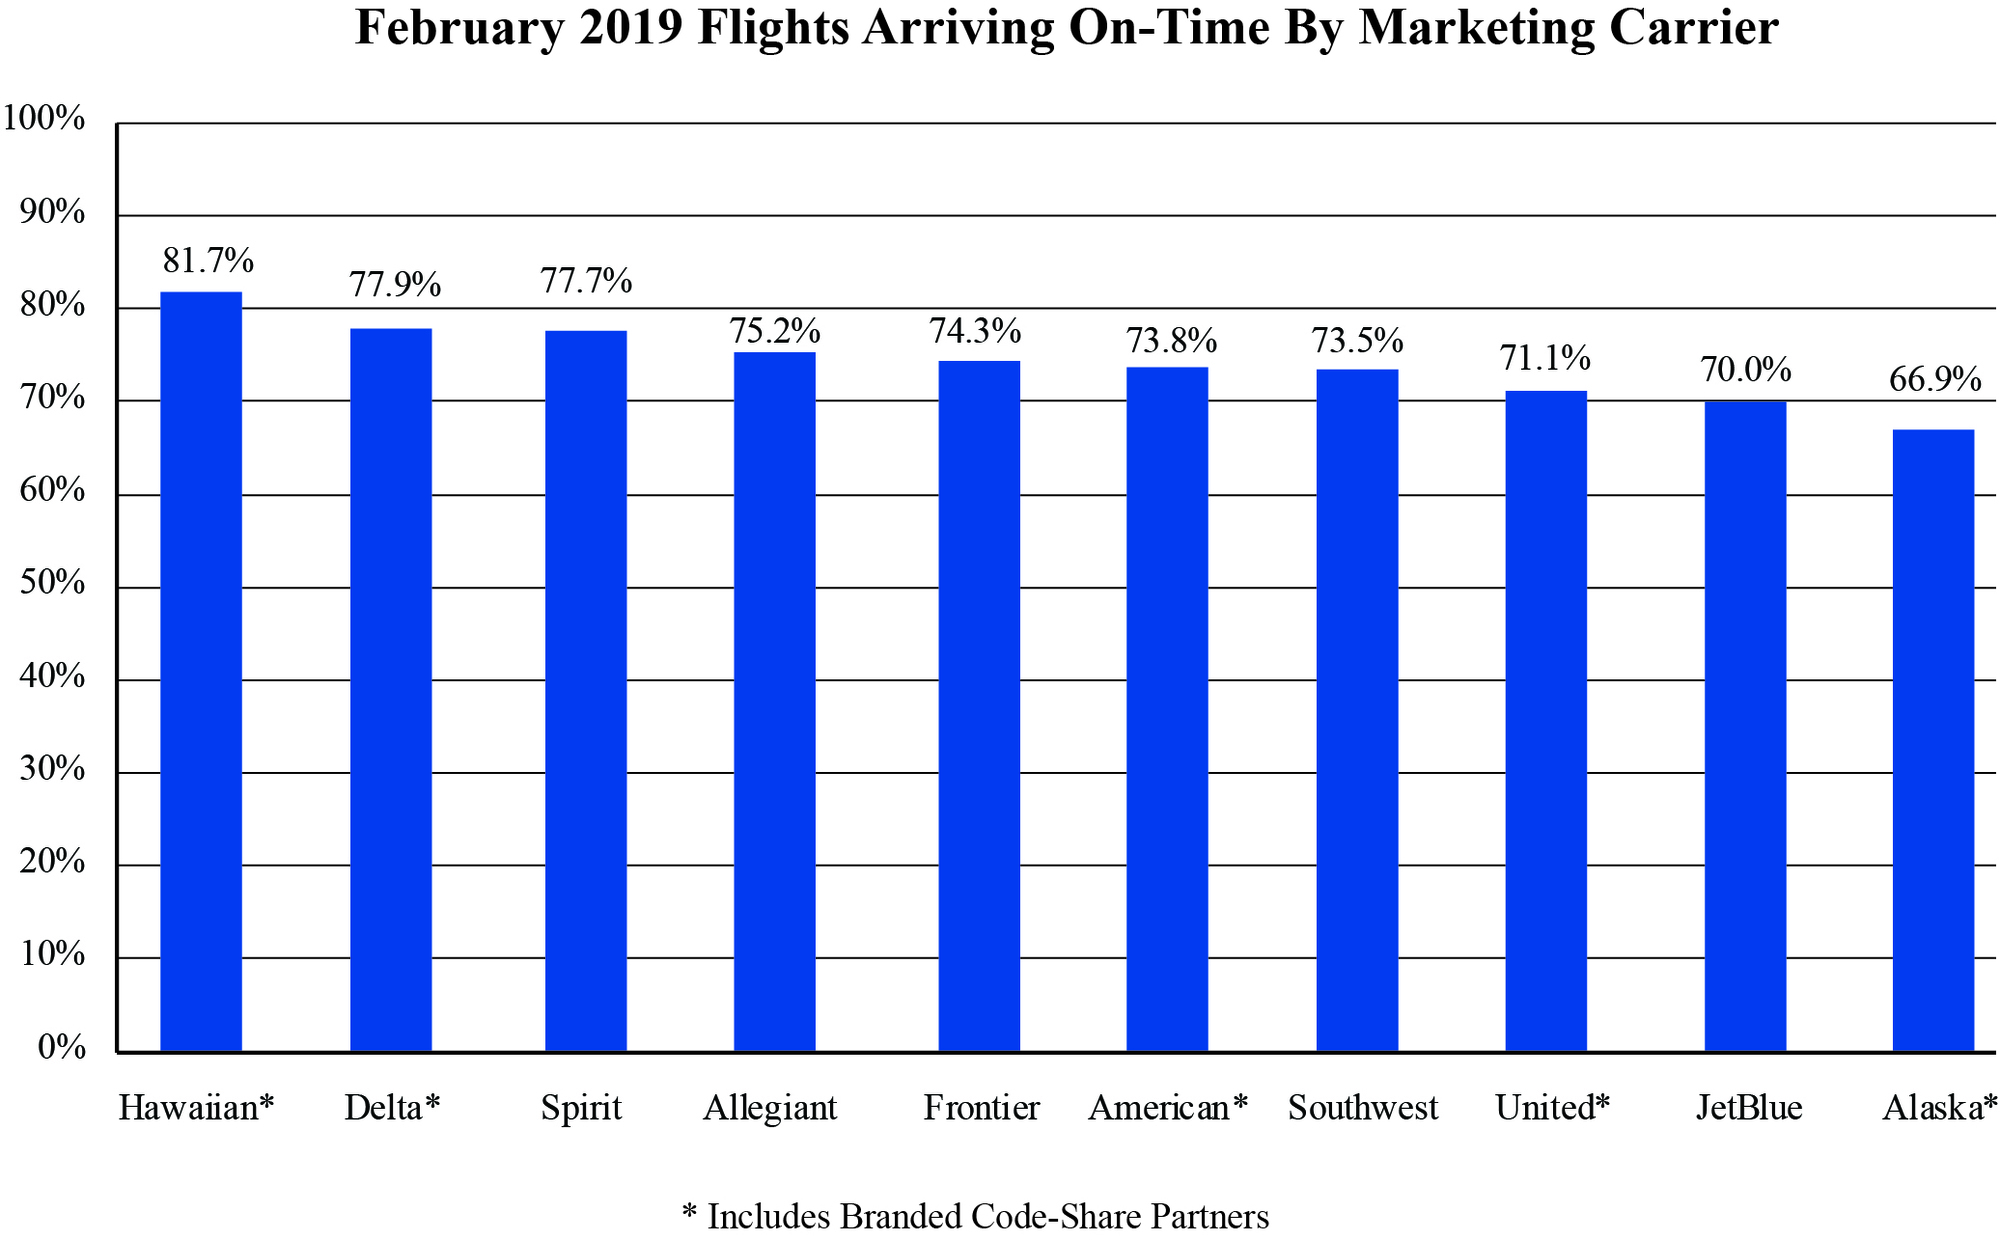
Air Travel Consumer Report: February 2019 Numbers
April 18
In February 2019, reporting marketing carriers posted an on-time arrival rate of 73.8%, down from both the 78.4% on-time rate in January 2019 and from 78.9% in February 2018. The reporting marketing carriers canceled 3.1% of their scheduled domestic flights, equal to the rate of 3.1% in January 2019 but higher than 1.9% in February 2018.
-
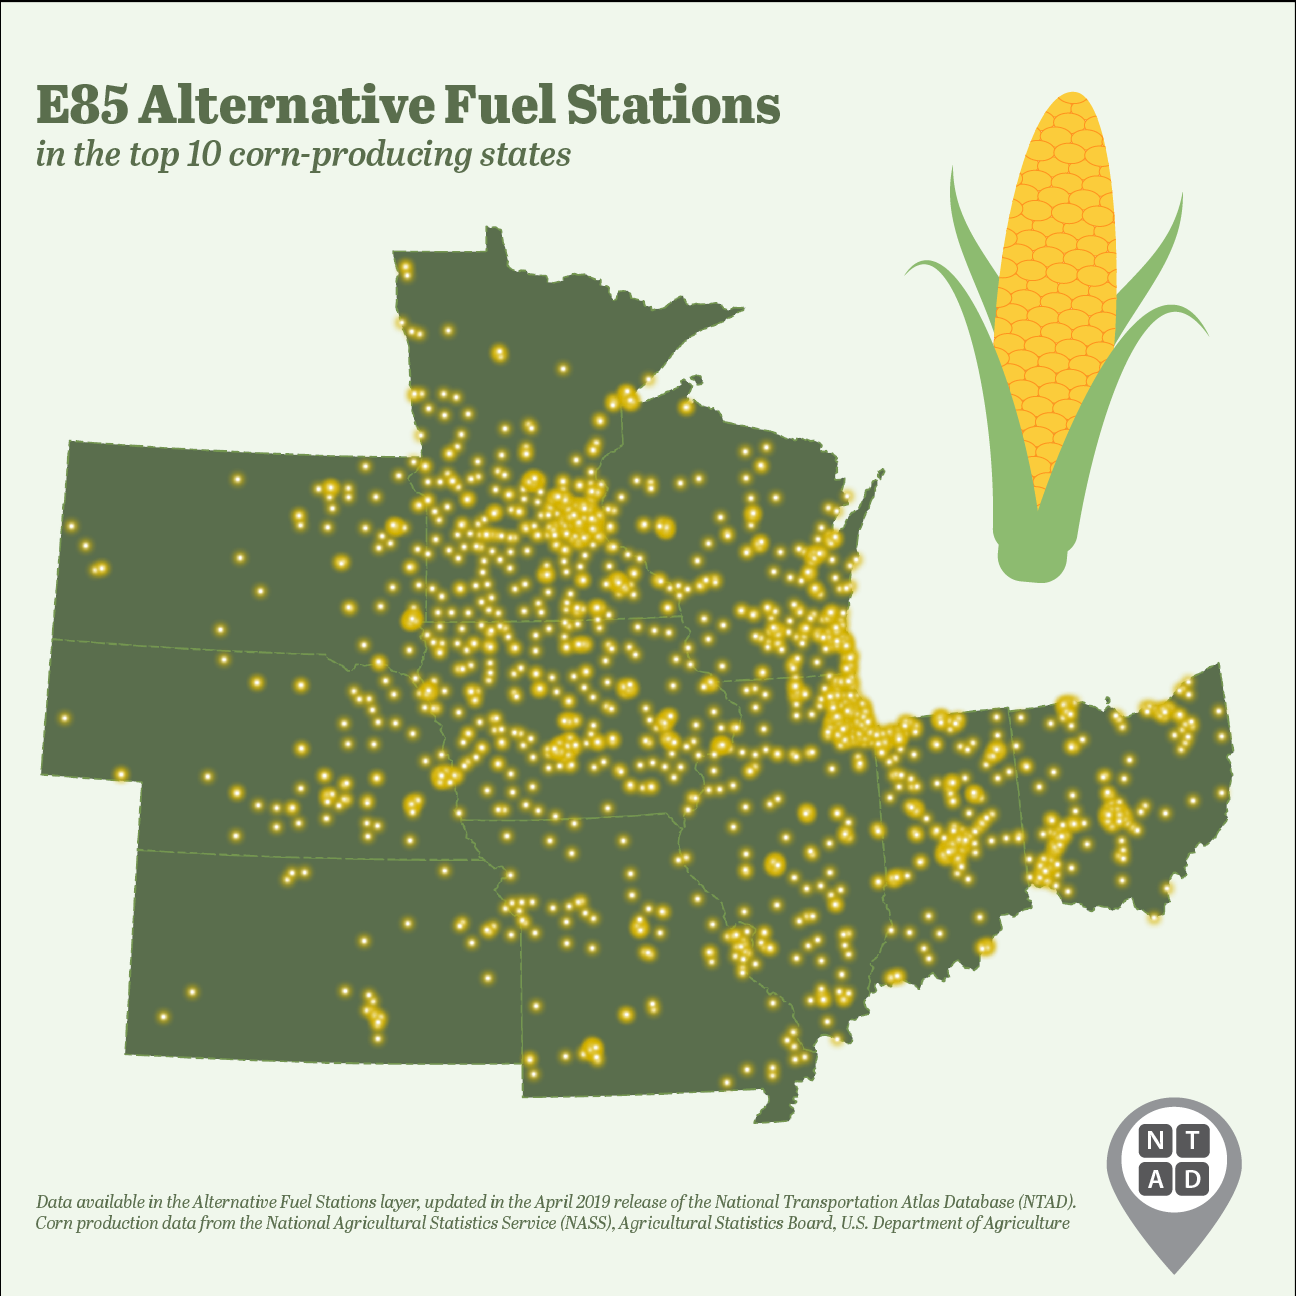
National Transportation Atlas Database, Spring Update
April 19
The
National Transportation Atlas Database (NTAD) Spring update was released with two new datasets, five revised datasets, and a new data catalog. NTAD is a Bureau of Transportation Statistics (BTS) compilation of geospatial datasets representing the nation’s transportation infrastructure, containing roadways, railways, waterways, and airports. The two new datasets in this version are the U.S. Department of Transportation regions and air to truck intermodal freight facilities. The air to truck facilities layer is the second in a series of datasets to be released as part of the
Intermodal Freight Facility database.
See BTS Release Schedule
BTS Contact: Dave Smallen
202-366-5568
david.smallen@dot.gov