
USDOT Announces Solving for Safety Visualization Finalists
U.S. Department of Transportation sent this bulletin at 04/08/2019 11:30 AM EDT |
|
Having trouble viewing this email? View it as a Web page.
|
USDOT Announces Solving for Safety Visualization Finalists
WASHINGTON – The U.S. Department of Transportation (DOT) today announced two finalists, Ford Motor Co. and the University of Central Florida, for the third and final stage of the Solving for Safety Visualization Challenge. The challenge, a national, multistage competition with a total prize of $350,000, was announced last year, seeking innovative analytical visualization tools that can improve safety on our nation’s road and rail systems.
“These tools are revealing insights about transportation safety beyond our expectations for this challenge,” said DOT Under Secretary for Policy Derek Kan. “We’re thrilled to have finalists who are integrating data from both public and private sources to build innovative tools that help protect users of our Nation’s roads.”
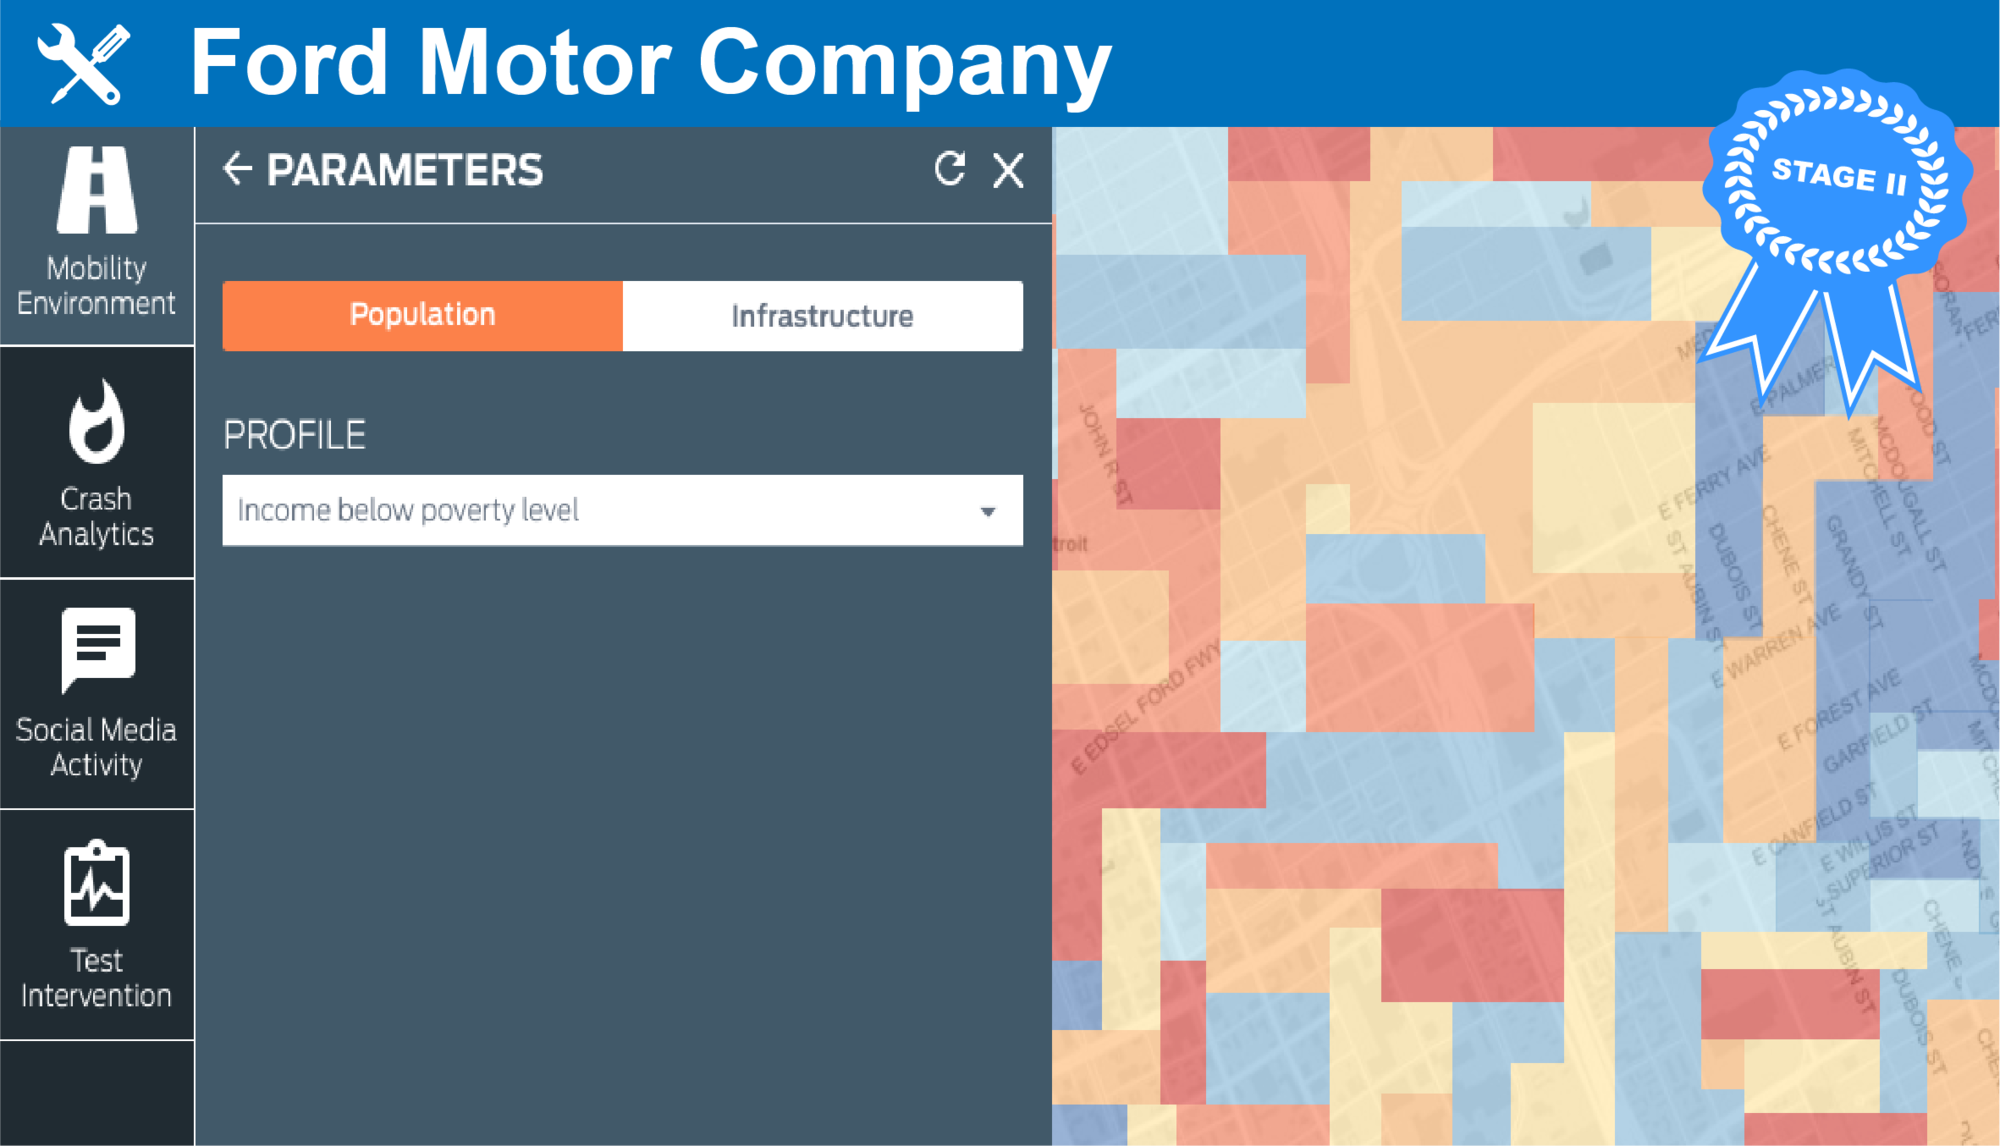
• Ford Motor Co. (Detroit) will combine traditional crash data with connected vehicle and driver behavior, social media, and population data along with the Highway Safety Manual and Crash Modification Factors to help decision-makers uncover insights about safety opportunity areas, simulate potential interventions, and evaluate predicted impact.
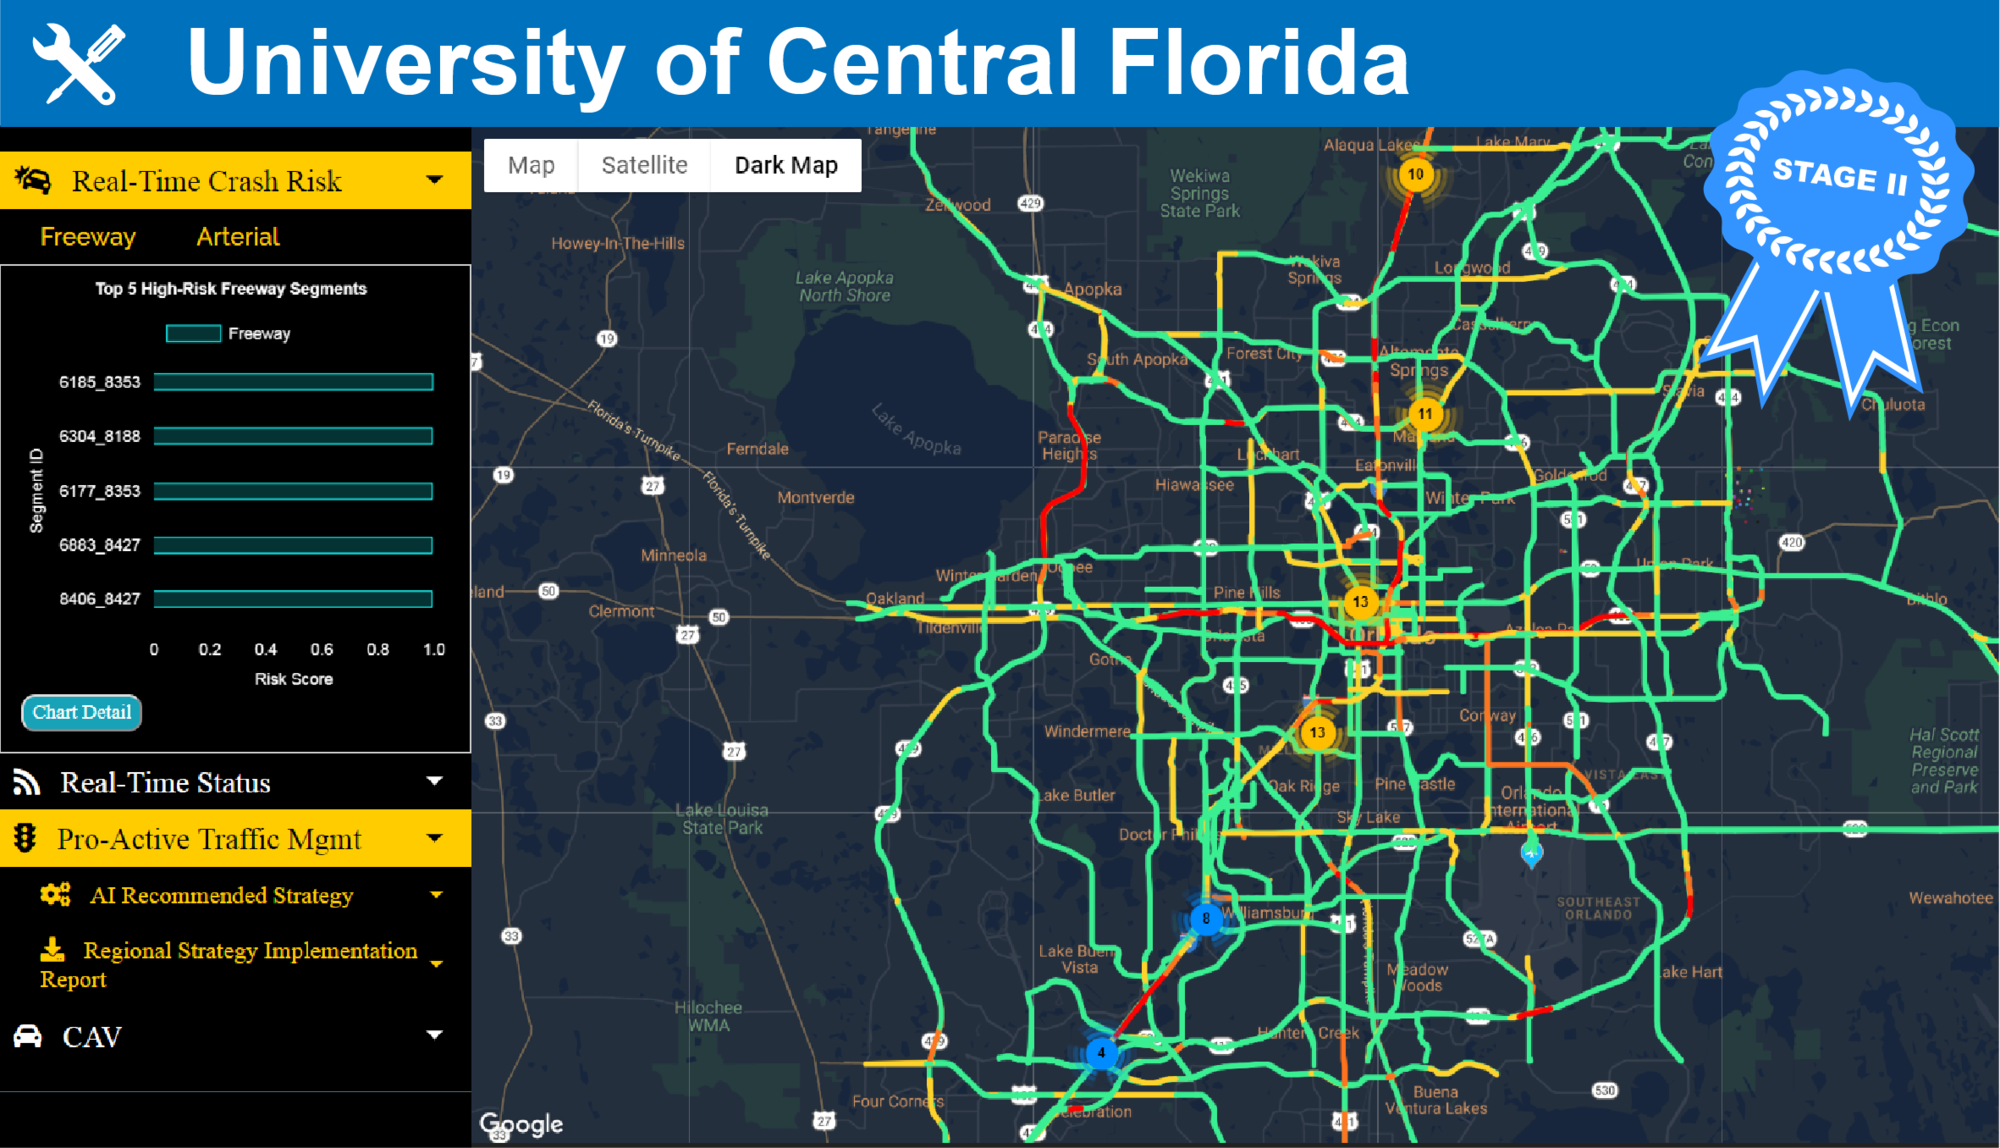
- The University of Central Florida (Orlando, Fla.) will use Artificial Intelligence and integrate real-time and static data, providing predictive analytics and diagnosing real-time traffic safety conditions to suggest real-time interventions and long-term countermeasures to decision makers and operators and inform the public of zip-code level safety conditions.
DOT has invited each finalist to advance to Stage III of the competition, which challenges contestants to develop their proofs of concept into full working analytical visualization tools. After demonstrating their tool, the two finalists will be awarded part of the final prize.
The challenge was created to advance the use of safety data visualizations for answering analytical questions related to surface transportation system safety. Analytical visualization tools can cast new light on data to reveal insights into safety and prevention of serious crashes not seen through traditional analysis. The two finalists were selected from five semi-finalists who were selected from a pool of 54 submissions and evaluated by DOT technical experts.
Stage I was a six-week stage in which applicants provided their ideas for the analytical visualization tool. Stage II was a four-week concept development stage in which five semi-finalists presented a more detailed concept and prototype of their tool. Two finalists are entering the third stage in which they will develop full working tools and compete for a portion of the final prize. For more information, visit: https://www.transportation.gov/solve4safety.
###
|
You are subscribed to DOT email updates. Subscriber Services: Manage Preferences |
|
||||||||||||
