
BTS Statistics Release: 1st-Quarter 2017 Air Fare Data
U.S. Department of Transportation sent this bulletin at 07/25/2017 11:01 AM EDT |
|
Having trouble viewing this email? View it as a Web page.
|

BTS 36-17
Tuesday, July 25, 2017
Contact: David Smallen
Tel: 202-366-5568
BTS Statistics Release: 1st-Quarter 2017 Air Fare Data
The average domestic air fare decreased to $352 in the first quarter of 2017, down 5.0 percent from $370 in the first quarter of 2016, adjusted for inflation but up 1.5 percent from $347 in the fourth quarter of 2016 (Table 1), the U.S. Department of Transportation’s Bureau of Transportation Statistics (BTS) reported today.

Source: Bureau of Transportation Statistics, BTS Air Fares, Origin and Destination Survey
BTS reports average fares based on domestic itinerary fares. Itinerary fares consist of round-trip fares, unless the customer does not purchase a return trip. In that case, the one-way fare is included. One-way trips accounted for 34 percent of fares calculated for the first quarter of 2017. The average domestic one-way air fare was $256 in the first quarter of 2017, while the average round-trip air fare was $417. Fares are based on the total ticket value, which consists of the price charged by the airlines plus any additional taxes and fees levied by an outside entity at the time of purchase. Fares include only the price paid at the time of the ticket purchase and do not include fees for optional services, such as baggage fees. Averages do not include frequent-flyer or “zero fares.” Constant 2017 dollars are used for inflation adjustment.
Inflation-Adjusted Air Fares
The first quarter fare of $352 was the lowest first-quarter fare in the 22 years since BTS began collecting air fare records in 1995. The previous low was $370 in the first quarter of 2016. The first-quarter 2017 fare was down 28.3 percent from the average fare of $491 in 1999, the highest inflation-adjusted first quarter average fare on record. Since 1995, inflation-adjusted fares declined 26.5 percent (Table 1). See BTS Air Fare web page for historic data.
In recent years, airlines have obtained additional revenue from fees charged to passengers, as well as from other sources. U.S. passenger airlines collected 73.7 percent of their total revenue from passenger fares during the first quarter of 2017, down from 87.6 percent in 1995 (Table 2).
Quarter-to-Quarter Change
Average fares rose 1.5 percent from $347 in the fourth quarter of 2016 to the $352 in the first quarter of 2017, the second consecutive quarterly increase. Prior to that, fares declined for six consecutive quarters after reaching an inflation-adjusted recent high of $402 in the first-quarter of 2015 (Table 3).
Unadjusted Air Fares
The $352 first-quarter 2017 average fare was down 2.6 percent from the first quarter 2016 fare of $361 dropping to the lowest first-quarter fare since $328 in 2010. The first quarter 2017 fare was down 12.5 percent from the fare of $396 in the third quarter of 2014, which was the highest average fare for any quarter since 1995. Since 1995, unadjusted fares rose 18.5 percent compared to a 61.3 percent increase in overall consumer prices (Table 4).
First quarter 2017 fares of $352 were up 1.5 percent, from the fourth-quarter 2016 fares of $347. The first quarter 2017 average fare was down 2.6 percent from the first quarter of 2016 ($361) and down 9.4 percent from the first quarter of 2015 ($388). See Air Fares for historical data.
Fares by Airport
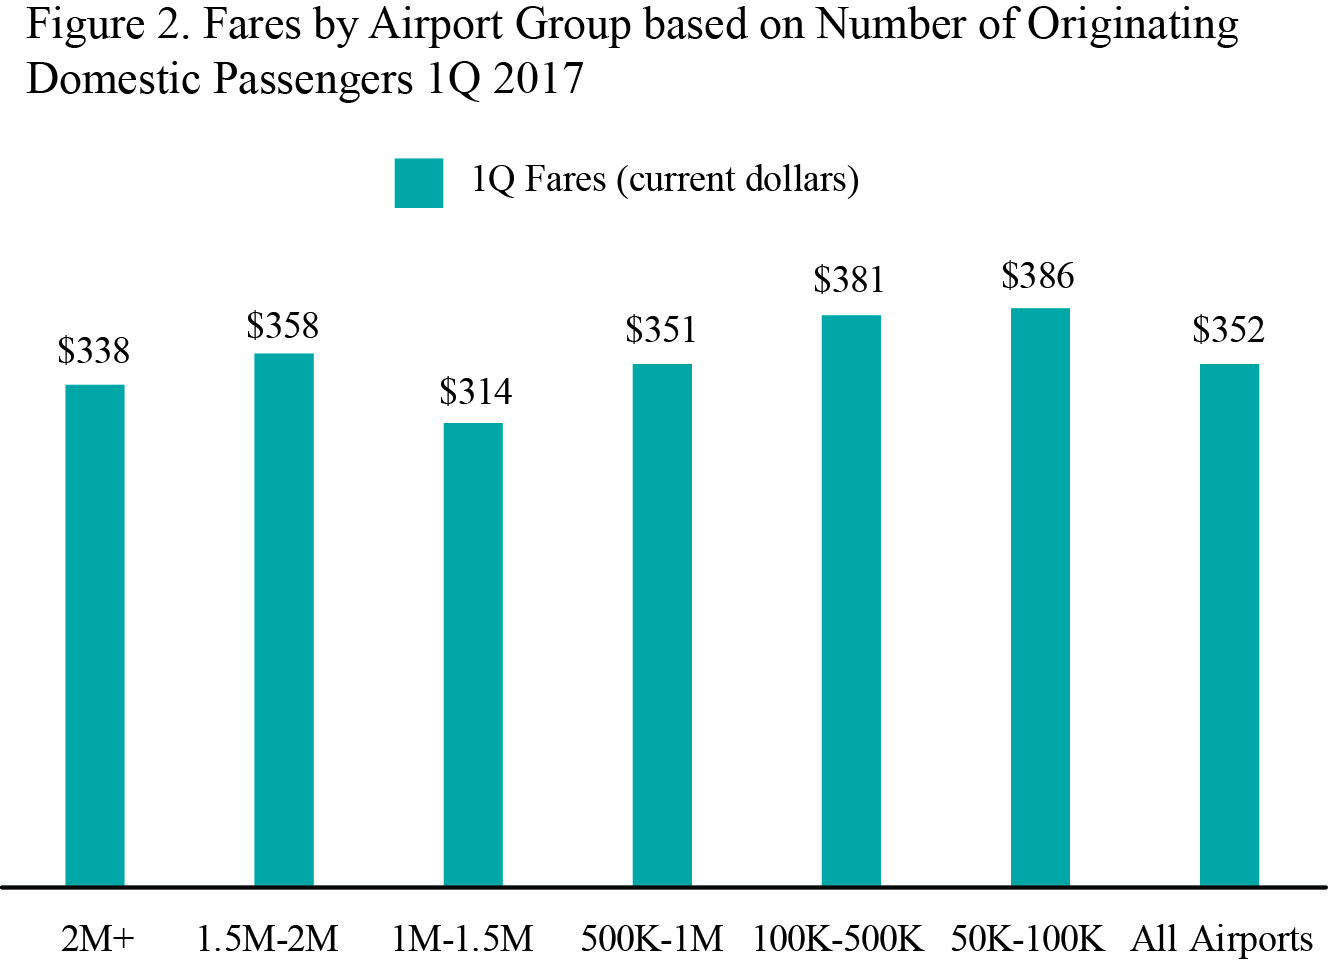
Of airports grouped by the number of originating passengers in the first quarter of 2017, the 13 airports with between 50,000 and 99,999 originating passengers had the highest average fares ($386). Airports with 1.0 to 1.49 million originating passengers had the lowest average fares of any group ($314) (Table 6).
Tables listing the airports by group can be found on the BTS Air Fare web page.
For additional data, see Top 100 Airports or All Airports. Since average fares are based on the Origin and Destination Survey 10 percent ticket sample, averages for airports with smaller samples may be less reliable. Fares for Alaska, Hawaii and Puerto Rico airports are not included in rankings but are available on the web page. Second Quarter 2017 average fare data will be released Oct. 17.
Note: Results for average fares are based on the BTS Origin & Destination Survey, a 10 percent sample of airline tickets used during the quarter. For results based on all itinerary fares, the standard error is 0.31 at the 90 percent confidence level range from $351.33 to $352.36. For results based on round-trip fares, the standard error is 0.40 at the 90 percent confidence level range from $416.43 to $417.76. For results based on one-way fares, standard error is 0.39 at the 90 percent confidence level range from $255.75 to $257.04.
Table 1. 1st Quarter Average Fare 1995-2017, Adjusted for Inflation
|
Year |
1Q Average Fare in constant 2017 dollars ($) |
Year-to-Year Percent Change in Average Fare (1Q to 1Q) (%) |
Cumulative Percent Change in Average Fare (1Q 1995 to 1Q of each year) (%) |
Percent Change in Average Fare to 1st Quarter 2017 (%) |
|
1995 |
479 |
-26.5 |
||
|
1996 |
446 |
-6.9 |
-6.9 |
-21.1 |
|
1997 |
432 |
-3.1 |
-9.7 |
-18.6 |
|
1998 |
458 |
6.0 |
-4.4 |
-23.2 |
|
1999 |
491 |
7.1 |
2.4 |
-28.3 |
|
2000 |
487 |
-0.7 |
1.7 |
-27.8 |
|
2001 |
482 |
-1.2 |
0.6 |
-27.0 |
|
2002 |
438 |
-9.1 |
-8.6 |
-19.6 |
|
2003 |
425 |
-3.0 |
-11.4 |
-17.1 |
|
2004 |
418 |
-1.4 |
-12.6 |
-15.9 |
|
2005 |
382 |
-8.7 |
-20.2 |
-7.9 |
|
2006 |
396 |
3.5 |
-17.4 |
-11.1 |
|
2007 |
380 |
-4.0 |
-20.7 |
-7.3 |
|
2008 |
383 |
0.7 |
-20.1 |
-8.0 |
|
2009 |
360 |
-5.8 |
-24.8 |
-2.3 |
|
2010 |
368 |
2.1 |
-23.2 |
-4.4 |
|
2011 |
391 |
6.1 |
-18.5 |
-9.9 |
|
2012 |
398 |
1.9 |
-16.9 |
-11.6 |
|
2013 |
397 |
-0.3 |
-17.1 |
-11.4 |
|
2014 |
396 |
-0.3 |
-17.4 |
-11.1 |
|
2015 |
402 |
1.7 |
-16.0 |
-12.6 |
|
2016 |
370 |
-8.0 |
-22.7 |
-5.0 |
|
2017 |
352 |
-5.0 |
-26.5 |
N/A |
Source: Bureau of Transportation Statistics, BTS Air Fares and Origin and Destination Survey
Note: Percent change based on unrounded numbers
Table 2. Passenger Airline Revenue from Fares 1990-2017
|
Year |
Revenue from Passenger Fares as Percent of Total Scheduled Passenger Airline Operating Revenue* (%) |
|
1990 |
88.5 |
|
1995 |
87.6 |
|
2000 |
88.9 |
|
2001 |
87.8 |
|
2002 |
87.1 |
|
2003 |
84.9 |
|
2004 |
80.6 |
|
2005 |
78.4 |
|
2006 |
77.6 |
|
2007 |
77.7 |
|
2008 |
75.9 |
|
2009 |
73.7 |
|
2010 |
74.8 |
|
2011 |
74.6 |
|
2012 |
74.1 |
|
2013 |
74.6 |
|
2014 |
74.8 |
|
2015 |
74.7 |
|
2016 |
74.1 |
|
2017 (1Q) |
73.7 |
Source: Bureau of Transportation Statistics, P-1.2
* From Schedule P-1.2: Passenger Revenue (Fares) (Acct 3901) as a percentage of Total Operating Revenues (4999).
Table 3. Inflation-Adjusted Average Domestic Airline Fares by Quarter
Average Fare and Percent Change by Quarter
|
Quarter/Year |
Average Domestic Fare (2017$) |
|
|
Average Fare in constant 2017 dollars ($) |
Quarter-to-Quarter Percent Change in Average Fare (%) |
|
|
1Q 2015 |
402 |
-0.6 |
|
2Q 2015 |
395 |
-1.8 |
|
3Q 2015 |
380 |
-3.9 |
|
4Q 2015 |
372 |
-2.0 |
|
1Q 2016 |
370 |
-0.4 |
|
2Q 2016* |
351 |
-5.3 |
|
3Q 2016* |
344 |
-1.9 |
|
4Q 2016* |
347 |
0.8 |
|
1Q 2017* |
352 |
1.5 |
Source: Bureau of Transportation Statistics, BTS Air Fares and Origin and Destination Survey
Note: Percent change based on unrounded numbers
* Fares for the most recent four quarters are in current dollars, not adjusted for inflation.
Table 4. Unadjusted 1st Quarter Average Fares, 1995-2016
|
Year |
Average Fare in current dollars ($) |
Year-to-Year Percent Change in Average Fare (1Q to 1Q) (%) |
Cumulative Percent Change in Average Fare (1Q 1995 to 1Q of each year) (%) |
Inflation Rate from 1995 (Mar 1995 to Mar of each year)* |
|
|
1995 |
297 |
N/A |
N/A |
N/A |
|
|
1996 |
284 |
-4.4 |
-4.4 |
2.7 |
|
|
1997 |
283 |
-0.2 |
-4.5 |
5.8 |
|
|
1998 |
305 |
7.5 |
2.6 |
7.3 |
|
|
1999 |
332 |
8.9 |
11.7 |
9.1 |
|
|
2000 |
340 |
2.6 |
14.6 |
12.6 |
|
|
2001 |
348 |
2.2 |
17.1 |
16.5 |
|
|
2002 |
320 |
-8.0 |
7.8 |
17.9 |
|
|
2003 |
319 |
-0.3 |
7.5 |
21.3 |
|
|
2004 |
320 |
0.3 |
7.9 |
23.5 |
|
|
2005 |
301 |
-5.9 |
1.5 |
27.2 |
|
|
2006 |
323 |
7.3 |
8.9 |
31.9 |
|
|
2007 |
318 |
-1.7 |
7.1 |
35.1 |
|
|
2008 |
333 |
4.9 |
12.3 |
40.6 |
|
|
2009 |
314 |
-5.8 |
5.7 |
40.5 |
|
|
2010 |
328 |
4.6 |
10.5 |
43.8 |
|
|
2011 |
356 |
8.4 |
19.8 |
46.9 |
|
|
2012 |
373 |
4.8 |
25.6 |
51.1 |
|
|
2013 |
378 |
1.4 |
27.3 |
53.6 |
|
|
2014 |
382 |
1.1 |
28.7 |
55.8 |
|
|
2015 |
388 |
1.6 |
30.8 |
55.7 |
|
|
2016 |
361 |
-7.0 |
21.7 |
57.3 |
|
|
2017 |
352 |
-2.6 |
18.5 |
61.3 |
Source: Bureau of Transportation Statistics, BTS Air Fares and Origin and Destination Survey
Note: Percent change based on unrounded numbers
Table 5. Unadjusted Average Domestic Airline Fares by Quarter
Average Fare and Percent Change by Quarter
|
Quarter/Year |
Average Domestic Fare (current$) |
|
|
Average Fare in current dollars ($) |
Quarter-to-Quarter Percent Change in Average Fare (%) |
|
|
1Q 2015 |
388 |
-1.1 |
|
2Q 2015 |
386 |
-0.6 |
|
3Q 2015 |
372 |
-3.7 |
|
4Q 2015 |
363 |
-2.5 |
|
1Q 2016 |
361 |
-0.4 |
|
2Q 2016 |
351 |
-2.9 |
|
3Q 2016 |
344 |
-1.9 |
|
4Q 2016 |
347 |
0.8 |
|
1Q 2017 |
352 |
1.5 |
Source: Bureau of Transportation Statistics, BTS Air Fares and Origin and Destination Survey
Note: Percent change based on unrounded numbers
Table 6. Fares at Airports Grouped by Originating Passengers
Top 100 Airports* Based on 4Q2016 U.S. Originating Domestic Passengers
|
Airport Groups based on 1Q 2017 Originating Passengers |
Average Fare 1st Quarter 2017 ($) |
Percent of Total Passengers |
|
2 million+ |
338 |
14 |
|
1.5-1.99 million |
358 |
22 |
|
1.0-1.49 million |
314 |
15 |
|
500-999,000 |
351 |
24 |
|
100-499,000 |
381 |
14 |
|
50-99,999 |
386 |
2 |
|
Average Fare at Top 100 Airports |
350 |
91 |
|
Average Fare at All Airports |
352 |
100 |
Source: Bureau of Transportation Statistics, BTS Air Fares and Origin and Destination Survey
* Not including Alaska, Hawaii or Puerto Rico
|
You are subscribed to DOT email updates. Subscriber Services: Manage Preferences |
STAY CONNECTED | |||||
|
|
|
|
|
|
|
|


