USGS Water News
In this issue, we spotlight major growth in real‑time water‑visibility tools, share new national studies on groundwater, pesticides, drought, salinity, PFAS, and nutrient modeling, and highlight cutting‑edge advances that strengthen how we monitor and understand water across the country.
Do you know someone who would enjoy this newsletter? Click here to forward it and encourage them to subscribe!
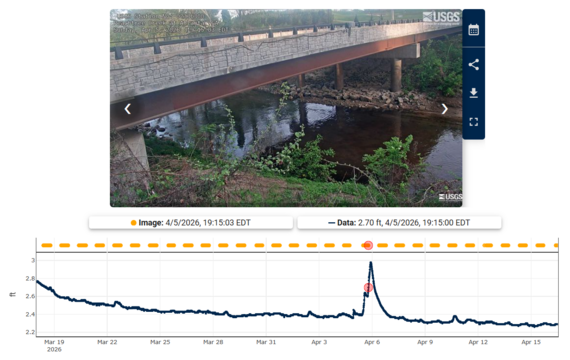 The HIVIS Dashboard pairs recent still-frame images with interactive hydrographs for many sites, including this camera on Peachtree Creek in Atlanta, GA.
The USGS Hydrologic Imagery Visualization and Information System (HIVIS) now includes more than 1,000 active webcams across the country, giving the public and decision makers real‑time visibility into current water conditions. The HIVIS network partners with multiple federal, state, and local agencies to deliver nationwide access to visual water‑condition information. Installed at streamgages and other hydrologic sites, these cameras provide still‑frame imagery that helps people interpret changing water levels, understand local conditions, and make informed safety decisions. The images also support USGS science by helping identify equipment issues, verify remote measurements, and supply visual data for research.
Accessible through the HIVIS Dashboard, users can explore photos and timelapse videos from Puerto Rico to Alaska, often paired with interactive hydrographs that turn abstract data into clear, intuitive information. This visual context improves situational awareness for emergency managers, transportation agencies, planners, and the public. Recent flood events, including those in Central Texas and Ruidoso, New Mexico, highlight the growing value of the system as a tool for public safety and hazard response.
Reaching 1,000 cameras marks a major milestone in delivering actionable hydrologic information. As the network continues to expand, HIVIS strengthens the nation’s ability to monitor water conditions in real time and communicate critical information to communities nationwide.
drought in the United States, 1981-2020
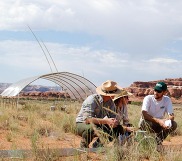
A new USGS-led study developed groundwater drought metrics and analyzed groundwater levels across the conterminous United States to characterize groundwater drought severity, duration, and changes through time. Using data from approximately 1500 monitoring wells, researchers found that groundwater drought tends to last longer and be more severe in drier regions like the Southwest. In contrast, many areas in the Northeast experienced decreasing groundwater drought severity in recent decades, while parts of the Southeast saw increases.
The monitoring well results were compared to satellite-based Gravity Recovery and Climate Experiment Drought Monitor Data Assimilation (GRACE-DADM) groundwater estimates with this study highlighting differences between the two methods and underscoring both the promise and current limitations of remote-sensing methods. Long-term monitoring wells remain essential, particularly in western regions with limited groundwater data.
Read the paper or contact USGS scientist Melissa Lombard.
|
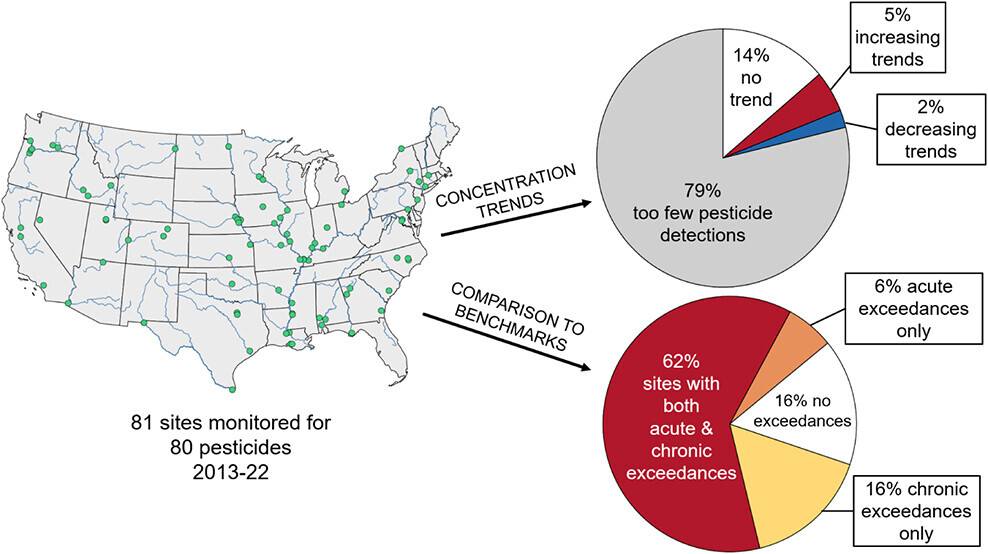 Map of 81 river sites sampled from 2013 to 2022 using an analytical method targeting 80 pesticides. The majority (79%) of single site and pesticide combinations had too few pesticide detections to estimate trends. Both acute and chronic aquatic life benchmark exceedances at 62% of sites.
Across the U.S., pesticides applied to farms, urban greenspaces, and other landscapes can move into rivers and streams, where they may affect aquatic plants, insects, fish, and even human health. A new national assessment draws on more than 10,000 water samples collected at 81 sites from 2013–2022 to track long‑term changes in 80 pesticides and compare measured concentrations to established benchmarks.
Most pesticides at single sites had too few detections to estimate trends, an encouraging sign that many pesticides are not commonly found in streams. But when pesticides were detected more frequently, concentrations increased about twice as often as they decreased. Nineteen pesticides exceeded aquatic‑life benchmarks for plants and invertebrates, with exceedances occurring across the country.
Read the paper or contact USGS scientist Megan Shoda.
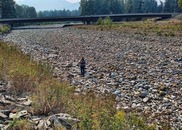
A new USGS-led study shows that machine learning can improve early warning of streamflow drought across the continental U.S. Using machine learning models, researchers predicted weekly streamflow percentiles up to 13 weeks ahead for more than 3,000 streamgages. The models performed best for moderate droughts as compared to extreme and severe droughts and were especially good at signaling drought onset and recovery at short lead times.
Although they didn’t outperform simple persistence forecasts for classifying drought intensity at long lead times, the machine‑learning approaches provided useful skill in forecasting 1- 4 weeks ahead during severe droughts. The study highlights both the difficulty of hydrologic drought forecasting and the promise of data‑driven tools to support drought early‑warning systems. The work also supports a new streamflow drought forecasting tool, River DroughtCast.
Read the paper or contact USGS scientist John Hammond for more information. Keep an eye out for the updated version of River DroughtCast later this year, which will include expansion to more gaged locations as well as ungaged watersheds.
|
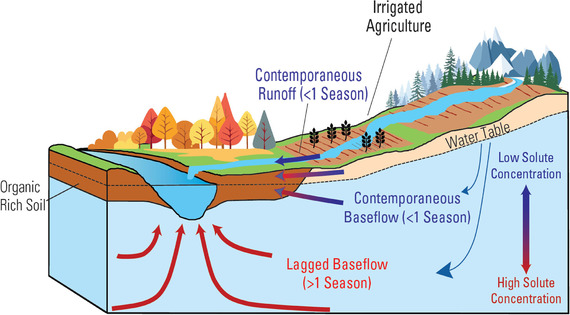 Conceptual diagram showing the transport of TDS from three end-member flow paths. Contemporaneous runoff and contemporaneous baseflow represent the transport of TDS to streams via land surface and sub-surface pathways, respectively, that reach the stream in less than one season. Lagged baseflow represents the lagged delivery of TDS via sub-surface pathways that takes longer than one season to reach the stream. Adapted from Tesoriero et al. (2013) and Miller, Tesoriero, et al. (2017).
A USGS study sheds light on where salinity is generated and how it moves through the Upper Colorado River Basin, where dissolved salts cause an estimated $350 million in annual damages. Using coupled water quality models (SPARROW) spanning 35 years, researchers traced total dissolved solids (TDS) from their origins in the watershed to their delivery into streams at a seasonal timestep. The models reveal that most TDS enters streams as baseflow, or groundwater discharge to streams, and that about half of the TDS takes more than one season to travel through the watershed. Snowmelt plays a key role, mobilizing salt that has been stored in soils and groundwater.
Salinity is a growing concern in the Colorado River Basin, which supplies water to millions across the southwestern United States and Mexico. Understanding sources of salinity and how and when salts move through the system can help identify effective mitigation strategies and support long‑term water‑resource planning.
Read the paper or contact Matthew Miller for more information.
shape biological responses in fish
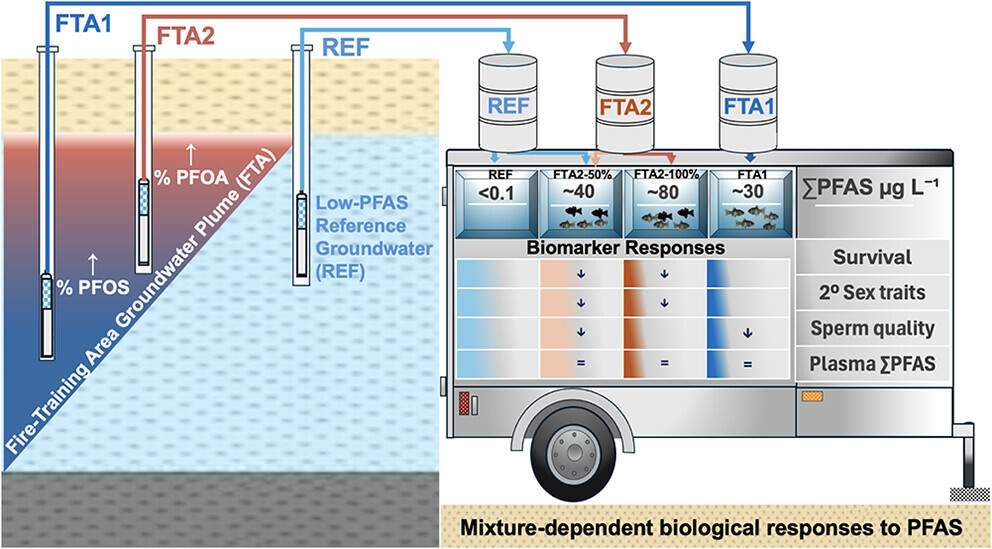 PFAS Mixture Composition and Internal Exposure Profiles Shape Biological Responses under Field-Realistic Exposure
PFAS are long‑lasting contaminants found in groundwater and surface water across the United States, including Cape Cod, Massachusetts, where groundwater is vital for drinking water and healthy ecosystems.
A USGS mobile‑laboratory study showed that fish exposed to PFAS‑contaminated groundwater take up PFAS in different patterns than what is found in the water itself. These internal PFAS profiles, which reflect the mix of individual chemicals rather than just total PFAS levels, provided clearer insight into biological effects. Fish exposed to the contaminated groundwater showed molecular, cellular, and organismal responses that may affect overall health, including changes in sperm performance and other reproductive indicators.
The study demonstrates that PFAS can move into connected surface waters, and create exposure pathways for aquatic organisms, wildlife, and people who consume affected fish.
Read the paper or contact USGS scientist Larry Barber
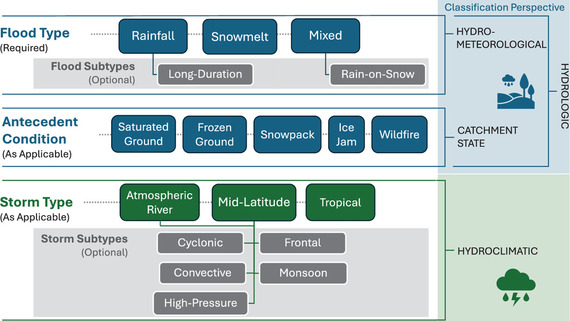 Flood-type classification schema and classification perspectives [see Tarasova et al. (2019) for details on flood classification perspectives] consisting of flood type representing the hydrometeorological perspective, antecedent condition representing the catchment state perspective, and storm type representing the hydroclimatic perspective. Optional subtypes of flood and storm type classifications are also shown.
A new Federal Emergency Management Agency funded study by the USGS and the U.S. Army Corps of Engineers provides the first nationwide dataset classifying historical floods by their causes. The team reviewed 1,763 annual peak floods from 18 streamgages across six U.S. river basins (1851–2022), assigning each event to a primary driver: rainfall, snowmelt, mixed precipitation, or undetermined, using a standardized flood typing framework.
The classifications show that 49% of floods were driven by rainfall, 28% by snowmelt, 22% by mixed precipitation, and 1% were unclassified. This new dataset will help create and test tools for flood typing methods and support improved flood frequency estimates and design tools.
Read the paper or contact USGS scientist Scott Hamshaw
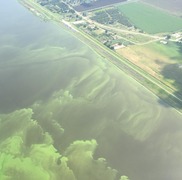
A new review of fifty years of river harmful algal bloom modeling highlights major gaps slowing progress. Analyzing 162 studies from over 80 rivers worldwide, the authors found most research centered on large, nutrient‑rich, flow‑altered rivers, with South Korea, Europe, the United States, and China contributing most of the work.
Models varied widely in approach and prediction goals. While traditional, process‑based models dominated, data‑driven (AI) methods have expanded with better computing and monitoring. However, inconsistent model documentation hindered comparison across studies. Key river features such as river bottoms, side channels, and backwaters were often overlooked.
The authors recommend improved reporting, shared benchmark datasets, cross‑disciplinary modeling ideas, and community‑built tools to create more transferable models and support future operational bloom forecasting in rivers.
Read the paper or contact USGS scientist Jennifer Murphy
|
estimate seasonal nutrients over 21 years in rivers across th
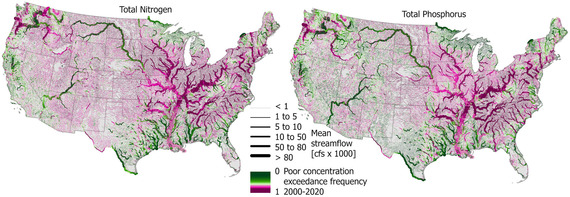 Frequency of mean seasonal flow-weighted total nitrogen and total phosphorus concentrations exceeding the US Environmental Protection Agency National Rivers and Streams Assessment “poor” criteria for 2000–2020.
Too much nitrogen and phosphorus in rivers and streams can harm fish, raise the cost of treating drinking water, and limit recreation. To better understand and address these issues, the USGS has developed new nationwide dynamic SPARROW (SPAtially Referenced Regression on Watershed attributes) models that simulate how nutrients move from the land into waterways and how past pollution continues to affect water today.
These new models track how nutrient sources and stream conditions change over time, showing where nutrients originate, how they move through watersheds, and where past sources still affect water quality. Spanning 21 years and more than 250,000 catchments across the lower 48 states, the models estimate how much nitrogen and phosphorus enter rivers, how those nutrients travel downstream, and which sources contribute most. This clearer picture helps communities and decision makers focus their nutrient‑reduction efforts and better protect water resources for people and ecosystems.
Read the paper or contact USGS scientist Olivia Miller
|