USGS Water News
In this issue, we learn about major advancements in satellite imagery for water monitoring, explore the results of several state-of-the-art models for water information, and celebrate 15 years of a tool used to inform water-quality science and management worldwide.
Do you know someone who would enjoy this newsletter? Click here to forward it and encourage them to subscribe!
Water-specific correction for satellite imagery advances remote sensing for water quality
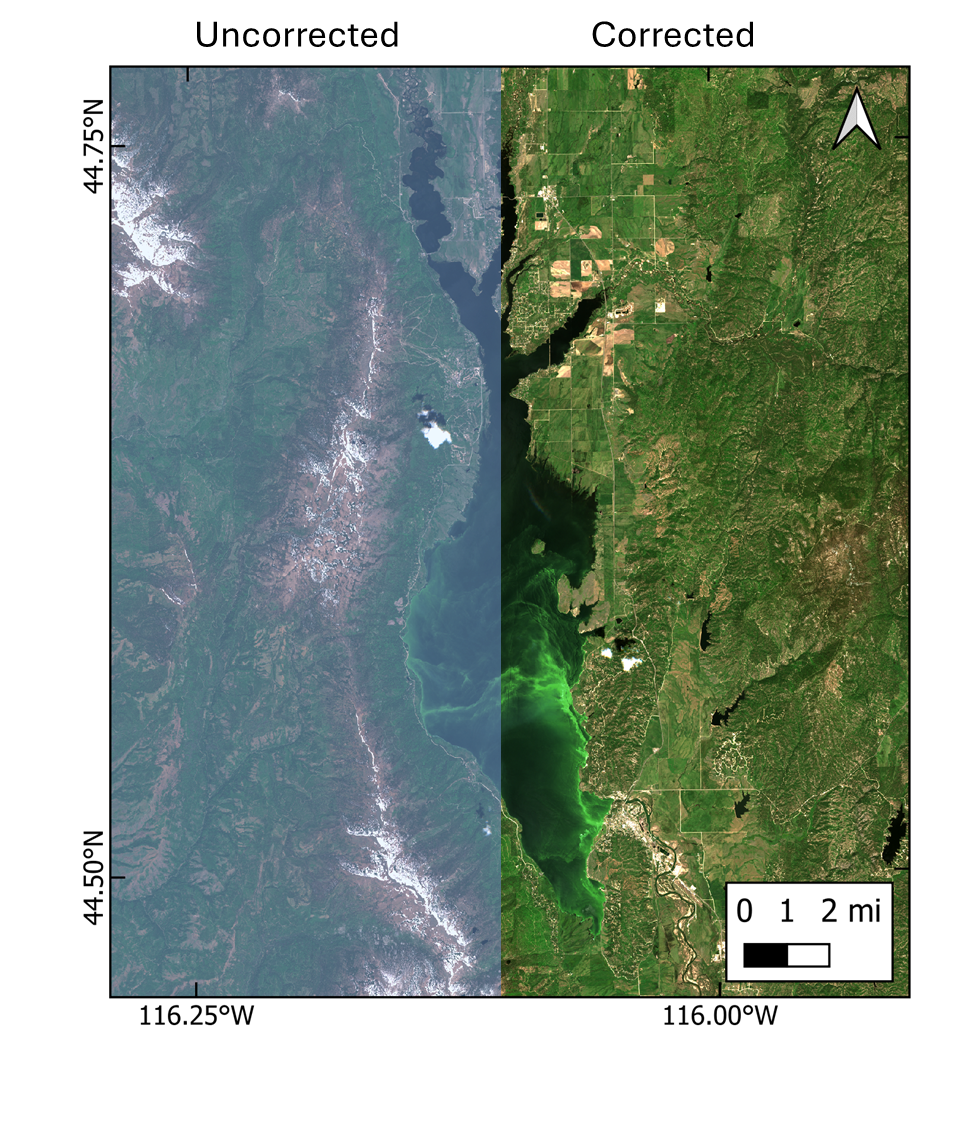 Sentinel-2 satellite imagery of Lake Cascade, Idaho from June 22nd, 2022. The left side of the image has had no atmospheric correction applied. The right side of the image has been processed using a water-specific atmospheric correction approach, which allows scientists to better quantify the severity of the algal bloom that is visible in the photo. Sources/Usage: Imagery provided by the European Space Agency.
A team of USGS scientists has released the first national-scale operational product that corrects satellite imagery for water. Atmospheric gases and aerosols distort the light reflected off Earth’s surface, so satellite data must be adjusted using a process known as atmospheric correction. Most national-scale products apply corrections designed for land, which do not perform well over water because light behaves differently in aquatic environments. This new USGS product uses a water-specific atmospheric correction applied across the full Sentinel-2 record for the lower 48 United States, providing water managers nationwide with a more accurate and consistent tool for monitoring water quality.
Read the paper, access the dataset, or contact USGS scientist Scott Ducar.
Innovations in satellite technology improve snow monitoring across the globe
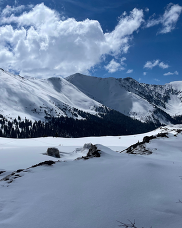
Scientists at the USGS, NASA, the USACE Cold Regions Research and Engineering Laboratory (CRREL), and academic partners are working together to advance the use of satellites for snow-water management. The new NASA-Indian Space Research Organisation Synthetic Aperture Radar (NISAR) satellite has the potential to revolutionize global snow monitoring by measuring changes in snow depth and water content in unmonitored and inaccessible mountain basins. Because mountain snowpacks act like water towers, storing the water supply for most of the western U.S. and much of the world, water managers rely on accurate predictions of snowmelt each year for water supply budgeting. Through this collaboration, USGS researchers are ground-truthing satellite measurements to ensure the accuracy and effective application of this new technology for snow monitoring worldwide.
Read the Eos feature article about the project or contact USGS scientist Randall Bonnell.
|
Supply and use index estimates water availability nationwide
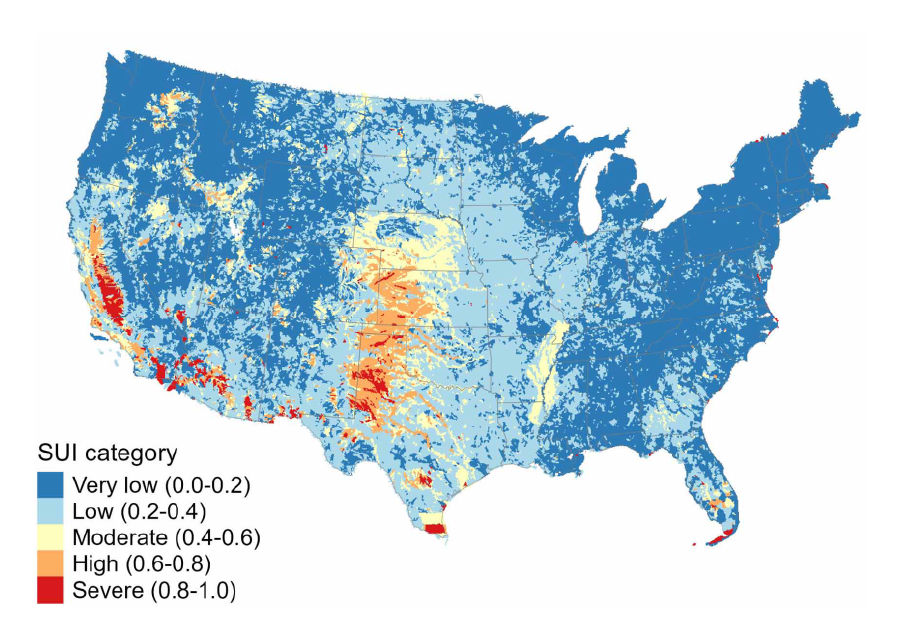 The model-based supply and use index (SUI) estimates monthly water availability across the lower 48 United States for water years 2010-2020. Sources/Usage: Modified from Stets et al. 2026, Environmental Research: Water, CC BY.
USGS researchers developed a model-based metric for assessing water availability across the lower 48 United States for water years 2010-2020. Called the “surface water supply and use index,” or SUI, this metric evaluates monthly water limitation as the difference between water supply and human consumptive water use. According to the index, approximately 26.7 million Americans—8% of the population in the lower 48 states—live in areas with chronic high or severe water limitation. Although large regions on the map appear to exhibit very low water limitation, local areas within those regions may be water limited. These high-resolution estimates of water availability promote comprehensive analyses of the drivers of water availability across the country and can help communities identify and avoid potential conflicts among human and ecosystem uses of water.
Read the paper or contact USGS scientist Edward Stets.
Melting ice sheets allow saltwater intrusion into freshwater aquifers
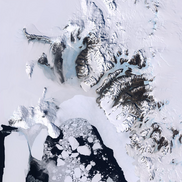
A new modeling study explains the link between ice sheet decline and saltwater intrusion in glaciated regions of the world. The models show that when ice sheets melt, pressure below ground decreases, altering the flow of groundwater. Near coastlines, this shift in pressure can allow saltwater to migrate landward into formerly freshwater aquifers. Saltwater intrusion is a major water quality concern for coastal communities living in glaciated regions. Understanding the mechanisms driving saltwater intrusion can help these communities prepare for and respond to declines in water availability.
Read the paper or contact USGS scientist Michelle Walvoord.
|
Concentrations of geogenic contaminants are commonly elevated and changing in drinking-water aquifers
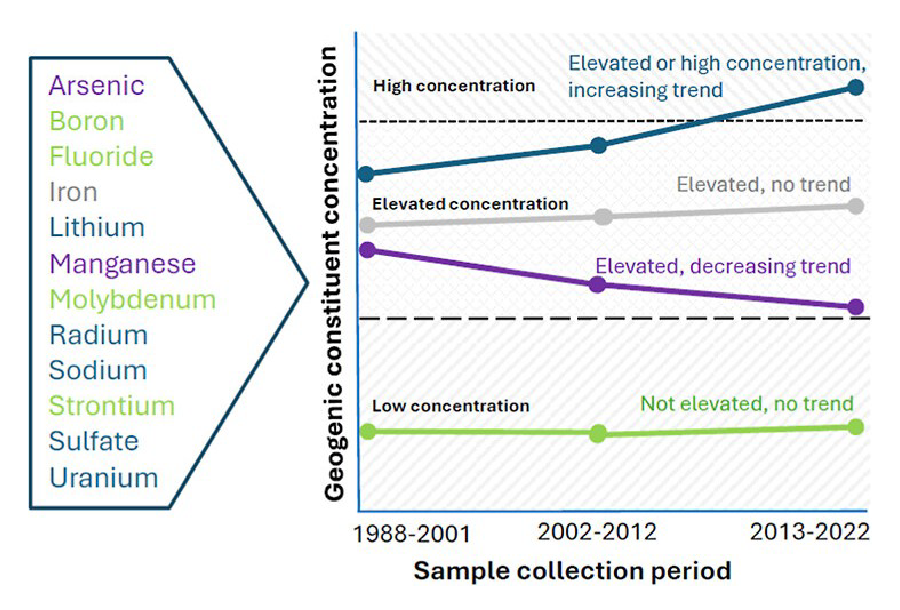 Generalized trends and concentrations of 12 geogenic contaminants (contaminants released from a geologic source) in U.S. groundwater between 1988 and 2022. Sources/Usage: Modified from Erickson et al. 2026, ES&T Water, CC-BY 4.0.
Elevated concentrations of geogenic contaminants (contaminants released from a geologic source) are widely present in drinking-water aquifers, according to a recent study by USGS scientists. Analyzing trends, occurrence, and mixtures of groundwater contaminants across aquifers of the lower 48 United States, researchers found that concentrations of most contaminants, including lithium, sodium, radium, and uranium, are increasing over time. Multiple contaminants were common in any given sample of water, and the EPA-regulated contaminants arsenic and uranium were commonly found with other contaminants. Geogenic contaminants limit the availability of groundwater for drinking across the country and globally. The results of this study can help water-resource managers and the public health community assess the potential risk of contaminant mixtures and develop additional guidance to protect public health.
Read the paper or contact USGS Scientist Melinda Erickson.
Four decades of modeled daily stream temperatures are now available nationwide
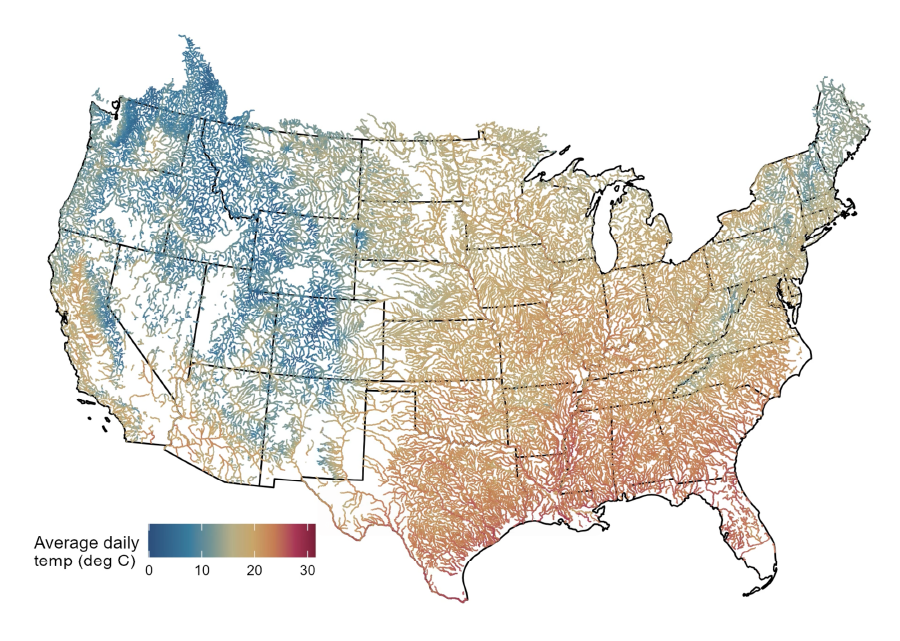 Snapshot of modeled stream temperature data from across the lower 48 United States on May 25, 2020. Sources/Usage: Public Domain.
USGS scientists recently published four decades of modeled daily stream temperature values for nearly 60,000 river reaches across the lower 48 United States. The team adapted machine learning methods used in social media and online shopping networks, which allowed them to use patchy stream temperature readings to generate modeled data that are more complete in space and time. These data can help guide water-management decisions, like the timing of reservoir releases for downstream fisheries or when water may be too warm for the regulated cooling of power plants, in streams that lack daily temperature observations.
Read the paper, download the dataset, or contact USGS scientist Jeremy Diaz.
USGS scientists create “Rosetta Stone” of waterbody identifiers
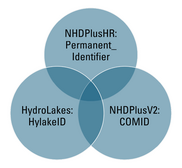
A new data release provides a crosswalk for unique identifiers used in common systems for mapping waterbodies of the lower 48 United States. Different agencies, organizations, and researchers use different identifiers for the same waterbodies, making it challenging to draw comparisons across datasets. By creating a “Rosetta Stone” for the most common identification systems (NHDPlusV2, NHDPlusHR, HydroLAKES), USGS scientists are providing a way to translate between complementary datasets and facilitate data sharing between user groups.
Download the dataset or contact USGS scientist Tyler King.
|
New modeling framework explains fish body size distributions in streams
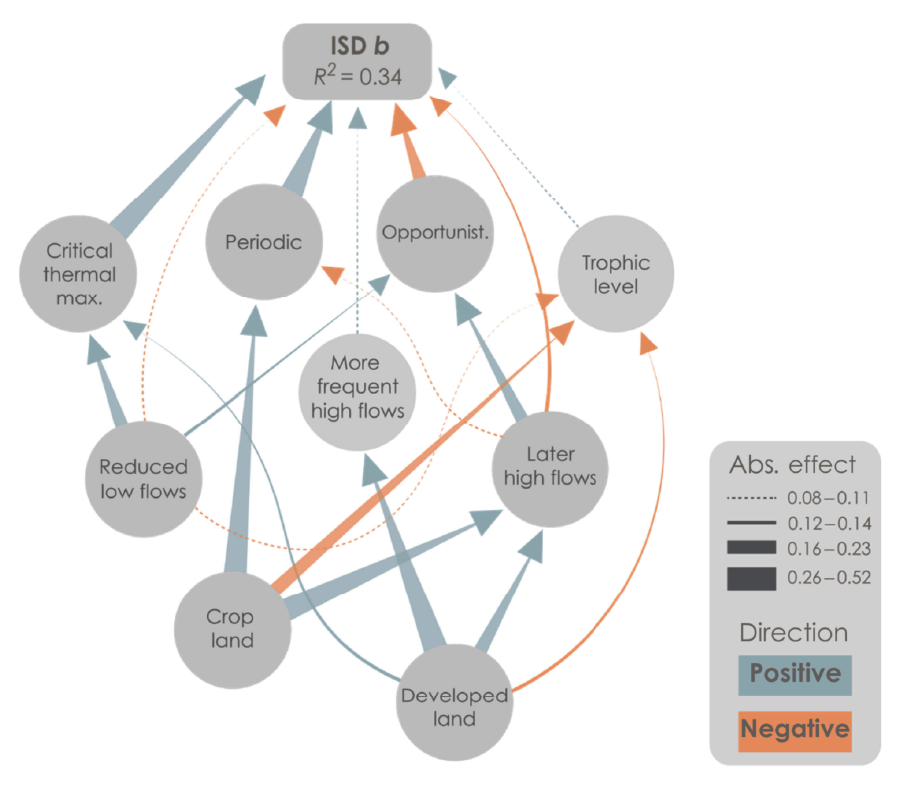 Final path analysis showing modeled relationships between the distribution of fish sizes (ISD b), fish traits, altered flow, and land use. Blue arrows indicate a positive effect, and orange arrows indicate a negative effect. The width of the arrow increases with effect size. Sources/Usage: Modified from Woods et al. 2025, Science Advances, CC-BY.
USGS scientists make big strides to predict fish size. New models include the effects of species traits (characteristics that define a species’ role in an ecosystem), flow regimes (magnitude, duration, frequency, and timing of high- and low-flow events), and land use on the distribution of fish sizes within a stream. Fish size is a critical metric for ecological research and is important for many recreational and commercial anglers. According to these new models, species traits affect fish size more directly than flow regimes or land use. The models can be expanded to include additional variables, like temperature and habitat, which might further explain fish size distributions and associated ecosystem processes.
Read the paper or contact USGS scientist Matthew Cashman.
USGS celebrates 15 years of WRTDS for water-quality science and management
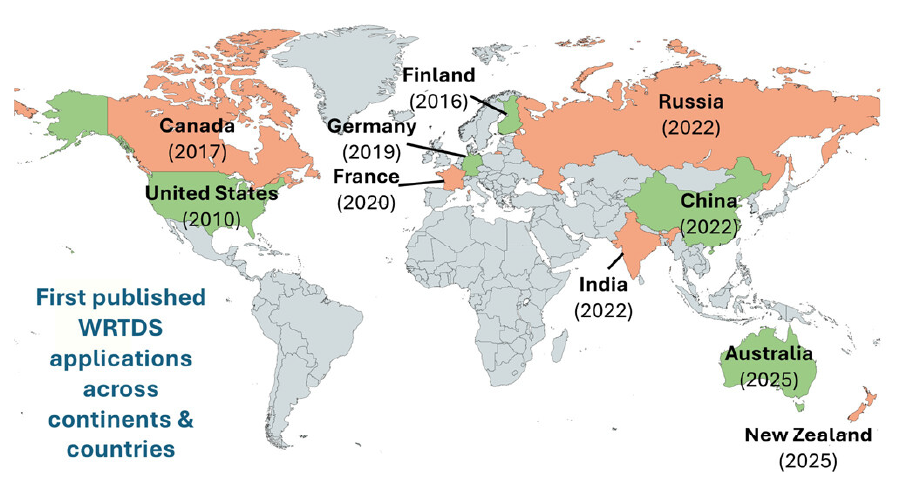 First published WRTDS applications across continents and countries, highlighting its global adoption. Colors are used to clarify the boundaries between neighboring countries. Sources/Usage: Zhang et al. 2026, ES&T, CC-BY 4.0.
Since its inception in 2010, the Weighted Regressions on Time, Discharge, and Season (WRTDS) method has grown into a state-of-the-art tool informing water-quality science and management across the globe. The free R package EGRET (Exploration and Graphics for RivEr Trends) makes WRTDS analysis easily accessible and has been downloaded more than 80,000 times by users across the U.S. and worldwide. The flexible, data-driven framework of WRTDS accounts for factors like streamflow variability and seasonality, which are crucial for understanding how water-quality constituents vary across space and time. Two recent publications co-authored by scientists at the USGS, University of Maryland Center for Environmental Science, and Chesapeake Bay Program reflect on the advancements made to WRTDS over the last 15 years, including its growing application to water-quality science and management challenges worldwide. One publication provides a comprehensive review of WRTDS, including its major methodological developments, expanding geographic and thematic applications, and relevance to water-quality management programs and policies worldwide. The second publication, presented as a brief comment, offers a forward-looking roadmap for the next generation of WRTDS development.
For more information, contact University of Maryland/Chesapeake Bay Program scientist Qian Zhang or USGS emeritus scientist Robert Hirsch.
|