
Wind and Water Power Newsletter Nov 2014
Sandia National Laboratories sent this bulletin at 12/01/2014 11:53 AM MST
Siting & Barrier Mitigation
Wind Turbine-Radar Interference Mitigation Field Test
Sandia National Laboratories and MIT Lincoln Laboratory recently concluded a 7-day field test campaign in the Tyler, MN region (Figure 2 is a photo of the test area) designed to evaluate a long-range radar and other technologies developed to mitigate the effect of wind turbines on radar systems. This test is a follow on to the Interagency Field Test & Evaluation (IFT&E) tests that were conducted in 2012 and 2013.
This latest test is part of the new Wind Turbine-Radar Interference Mitigation (WTRIM) Working Group that is co-sponsored by the Department of Energy, the Department of Defense, the Department of Homeland Security, the Department of Transportation's Federal Aviation Administration, and the National Oceanic and Atmospheric Agency. Unlike the completed IFT&E effort which had a narrow focus on quantifying the impacts of wind turbines on existing radar systems and evaluating near-term technologies proposed by industry to mitigate wind turbine interference, the WTRIM effort will pursue a more ambitious agenda. Not only will it look at technical near-term solutions but it will partner over the long run in examining wind turbine-radar interference mitigations ranging across the technical, project siting, and Federal policy spectrum.
For more information on these efforts and access to the IFT&E Industry Report please visit Sandia’s Wind Turbine/ Radar Interference Mitigation page.
Ben Karlson, (505) 377-3774.
Water Power: Wave Energy
|


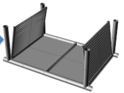 |
Figure 3. Rendering of a Floating OSWEC
|
Array Performance & Environmental Effects
Investigation of Seasonal Effects of Wave Energy Converters on the Nearshore Environment
To effectively generate commercial-scale power for an electric grid, Wave Energy Converter (WEC) devices need to be installed in arrays comprising multiple devices to efficiently convert wave energy into electrical power onshore. As the industry progresses from pilot- to commercial-scale, it is increasingly important to understand and quantify the relationships between the number of installed devices and the device-specific characteristics that have the potential to affect the natural nearshore processes that support a local, healthy ecosystem. Recent SNL efforts have focused on the potential for WEC arrays to alter nearshore wave propagation and circulation patterns, possibly modifying sediment transport patterns and ecosystem processes.
For this work a modified version of an industry standard wave modeling tool, SWAN (Simulating Waves Near-shore; developed by the Delft University of Technology, The Netherlands), was used to simulate wave propagation through a hypothetical WEC array deployment site on the California coast. The modified SWAN model, SNL-SWAN, was conducted in hindcast mode using recorded wave parameter boundary conditions.
Due to the abundance of site data to validate the modeling tools, Monterey Bay, located on the central California coast, was selected for the study. The following tasks were undertaken to investigate a simulated WEC array in Monterey Bay:
(1) Seasonal wave parameter (significant wave height, peak wave period, and wave direction) frequency distributions were constructed from hourly time series of National Oceanic and Atmospheric Administration National Data Buoy Center (NOAA NDBC) wave data collected between 1987 and 2013 at buoy station 46042.
(2) Median and extreme seasonal wave conditions were determined for NDBC buoy station 46042 and used as input to SNL-SWAN.
(3) SNL-SWAN wave propagation simulations were performed for two different types of WEC device types and for baseline conditions without WECs for median and extreme wave conditions over all four seasons.
(4) Modeled nearshore wave conditions in the presence and absence of simulated WEC array(s) were investigated.
Further, SNL used the potential alterations to nearshore wave conditions due to a simulated WEC array to quantify WEC effects on tidal circulation, shoreline erosion, and ecological change. In this work, wave results were incorporated into a numerical hydrodynamics and sediment transport model and used to determine potential changes in circulation and sediment transport patterns in the presence of WEC array(s).
Initial work has compared the changes in shear stress and sediment bed properties in the absence and presence of a WEC array comprised of 50, 20 meter diameter ‘point absorber style’ WECs arranged in a honeycomb/diamond shape and centered on the 40-m contour line about 4 miles offshore of Santa Cruz, CA. Figure 4 shows the bathymetry of the model domains used for this study, along with the WEC array arrangement and wave model output locations.
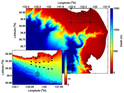 |
Figure 4. Monterey Bay and Santa Cruz (dashed lines) SNL-SWAN model domains (40 m depth contour indicated by the dotted line). The inset shows a close-up view of the Santa Cruz domain. The small black dots centered on the 40 m contour indicate the simulated WEC array comprising 50 point absorber device types. The larger black dots closer to shore are the model evaluation locations. |
The initial comparison of seabed shear stresses provides insight into the effect of a WEC array in the region. Figure 5 shows the difference in the maximum combined wave and current bottom shear stress for the October 2009 period with and with the WEC array. The primary differences were a reduction of shear stress (up to 3 dynes/cm2) in the lee of the array seen in light blue shading in Figure 5. The reduction was accompanied by a slight increase in shear stresses to the western edge of the domain. Figure 6 shows the response of the sediment bed after a month exposure to the WEC conditions.
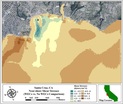 |
Figure 5. Difference in the maximum modeled bottom shear stress between the baseline and WEC array simulations for the October 2009 period.
|
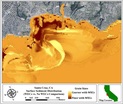 |
Figure 6. Comparison of changes in the surface sediment grain size between the WEC array and baseline conditions.
|
Further analysis revealed that the sediment bed grain size became slightly finer as a result of enhanced deposition and retention of fine sediment in the lee of the array. Conversely, the sediment bed coarsened down coast (to the east) of the affected region. Overall, the thickness of the bed slightly increased through the region with adjacent decreases, indicating a subtle shift in sediment due to the presence of the WEC array. Essentially, as should be expected, the overall reduction in wave height enhanced sediment accumulation in the region. Further studies will investigate how changing WEC device type, WEC array size/configuration, and distance offshore affect the nearshore coastal environment.
Jesse Roberts, (505) 844-5730.
DTOcean General Meeting, Lisbon, Portugal (October 14-16, 2014)
Jesse Roberts, Stan Atcitty, and Jason Heath of Sandia National Laboratories (SNL) attended the second general meeting of the Optimal Design Tools for Ocean Energy Arrays (DTOcean) project in Lisbon, Portugal, October 14-16, 2014. The EU-funded DTOcean project is developing a suite of whole-system design tools to support timely development and deployment of tidal and wave energy convertor arrays for the Marine Renewable Energy (MRE) industry. Economics (e.g., levelized cost of energy or LCOE), reliability, and environmental protection represent major goals of the project and constraints for the design tools. At twelve months into this three year project, the meeting focused intensely on the structure of the whole-system design tools that it is developing. Several breakout sessions vetted the following themes that comprise the submodule tools of an overarching integrating tool: hydrodynamics and array layouts; electrical system architecture; moorings and foundations; lifecycle logistics; and system control, operations, and maintenance. SNL is the one non-EU member of the 18 member organizations. Details on specific meeting activities and outcomes follow below.
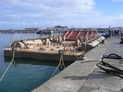 |
Figure 7. WaveRoller demonstration unit, ENP, Peniche, Portugal. The red flat panel moves under wave action; the large side tanks fill with water to secure the device to the seafloor.
|
The morning of Day 1 included a Technical Visit to a WaveRoller demonstration unit at the shipyard facilities of ENP (Estaleiros Navais de Peniche, S.A.), of the seaside city of Peniche, which is about an hour drive from Lisbon. The WaveRoller concept involves harvesting energy from wave motion by movement of large panels (see Figure 7). The WaveRoller concept was developed through computer simulations, tank tests, marine prototypes, and then full field demonstration and power production validation. In general, a fully deployed WaveRoller device is to operate in nearshore environments at depths from 8 to 20 meters, with power rating between 500 kW and 1000 kW (visit the WaveRoller website for more information). Following the site visit, afternoon meetings back in Lisbon presented the state of the project to the DTOcean Strategic Advisory Board. Presentations focusing on the overarching integrating design tool (see Figure 8) that incorporates the submodules, the submodules themselves, and the field scenarios for validation of the overarching design tool. All submodules are to address themes of economics, reliability, and the environment, and the global tool performs optimization (and communication between submodules) to output the minimized LCOE subject to reliability and environment impact constraints. Feedback from the Strategic Advisory Board stressed that the overarching design tool should be flexible to meet the needs of the validation scenarios as well as being capable of modelling a broad range of wave and tidal array deployment scenarios.
Days 2 and 3 included specific meetings and breakout sessions on reliability, operations and maintenance, environmental issues, and the themes of the tool submodules. As an example of technical outcomes and interaction between the team members of different submodules, it was decided that the mooring and foundation submodule will not directly consider the effect of mooring on the power performance, but will output stiffness characteristics that can be used by the hydrodynamics and array layouts module to calculate the effect on power performance—the global tool will optimize the mooring solution between the submodules as appropriate. Other discussions determined that the electrical system architecture submodule will provide the power umbilical cable data (e.g., minimum bending radius) to enable the mooring and foundations submodule to design the umbilical as part of the mooring system. Thus, the breakout sessions supported fruitful discussions to ensure proper information exchange between the submodules. SNL will continue to provide technical support to DTOcean with a focus on hydrodynamics and arrays, electrical architecture, and mooring and foundations, especially with the development of the calculation approaches and required databases (e.g., lookup tables). SNL will support the other submodules in an advisory role, but with a focus on the development of the global tool and optimization capabilities.
Jesse Roberts, (505) 844-5730.
Stanley Atcitty, (505) 284-2701.
Jason Heath, (505) 845-1375.
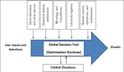 |
Figure 8. Schematic on structure of the global decision/design tool showing integration of submodules, the global database, and user inputs and selections.
|
Recent Publications
- “Nonlinear Time-Domain Performance Model for a Wave Energy Converter in Three Dimensions”, Coe, R., Bull, D. September 2014. SAND2014-17562C.
-
"IFT&E Industry Report", Karlson, B., LeBlanc, B., Minster, D., Estill, D., Miller, B., Busse, F., Keck, C., Sullivan, J., Brigada, D., Parker, L., Younger, R., Biddle, J. September 2014. SAND2014-19003.
In this Issue
|
Manage Subscriptions | Unsubscribe All | Help Copyright © 2014 Sandia National Laboratories, All Rights Reserved.
|