Wind Energy
SWiFT Restart Technical Review Committee Meeting (November 12–13, 2015)
The SWiFT Facility passed a critical milestone towards a complete restart of operations with the approval to re-mount rotors and complete the commissioning. The SWiFT Restart Technical Review Committee granted the approval when they met at the SWiFT Facility in Lubbock, TX, on November 12-13, 2015 (see
Figure 1, below). The committee included members from Sandia National Laboratories, National Renewable Energy Laboratory, Department of Energy, Texas Tech University, Vestas, Group NIRE, DNV, Westergaard Solutions, and E&L Software.
The technical review covered 32 corrective action measures including safety hardware, braking systems, software (configuration, revision control, and release procedure), hardware-in-the-loop test stand, documentation (operations procedures, turbine electrical and mechanical maintenance, and safety system design), barriers, signage, and emergency procedures. With 31 of the 32 required corrective actions were approved by the committee, the restart of the SWiFT facility is underway. The single corrective action that requires rework and review is a minor edit to a safety design document. The SWiFT SNL #1 turbine is expected return to operations in March 2015.
John White, (505) 284-5400
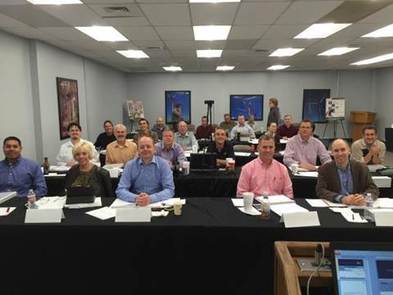 Figure 1. SWiFT Restart Technical Review Committee
Texas
Tech University mobile doppler radars provide unique wind measurements to
multi-instrument DOE Field Campaign
Over
the past few years, Texas Tech University researchers have been collecting and
analyzing dual-Doppler wind speed and direction data from operating wind plants
using their unique Ka-band (TTUKa) mobile Doppler radars. Researchers have
documented features of complex flow including turbine wakes, turbine-to-turbine
interaction, wind speed ramps, and small-scale gust/lull features called "streaks."
Their valuable observations
have led to a desire to understand how the dual-Doppler radar measurements
compare with more traditional wind assessment tools. To address this question, the
DOE-sponsored
eXperimental measurement campaign
for the Planetary boundary layer Instrument Assessment (or XPIA) in the spring of 2015. Over 120 hours of
radar data were collected in coordination with a 300-meter tall instrumented
meteorological tower and other traditional remote sensing platforms (such as profiling
and scanning lidars, radar profilers, and radiometers). The TTUKa scanning
strategies yielded a 2.5 km by 2 km area of horizontal wind speed and direction
data with points every 10 meters in the plane. Additionally, data from 15
horizontal planes located from 40 m to 180 m above ground yielded
an overall measurement volume. Quality radar data were acquired across a
variety of conditions, including rain, snow, and clear air.
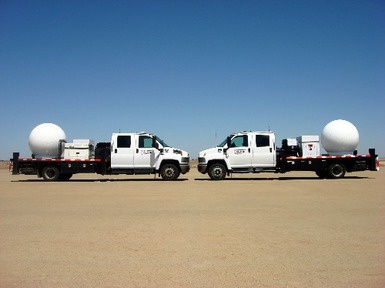 Figure 2. Texas Tech University mobile Ka-band Doppler radar trucks
On April 2, 2015, an extensive dataset was
collected as light to moderate snow fell over the XPIA domain. Three levels of
this dual-Doppler volume are displayed in Figure 3. A complex wind field is
evident at all three levels with lower wind speeds on the edges of the domain
and higher wind speeds in the center. A faint wind speed deficit extending from
the location of the 300 m tower (indicated by clear gaps in the data planes) suggests
a slight wake being produced by the tower. This wake signature was also seen in
composite images and noted to extend more than 1.5 km downstream.
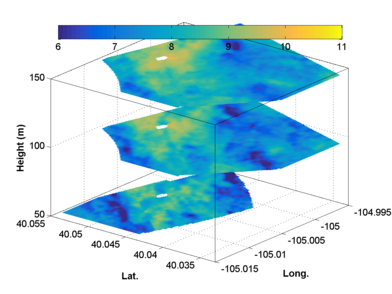 Figure 3. Volumetric representation of the wind maps at 50, 100, and 150 m at 22:11 UTC. The viewing angle is from the southwest. Wind speeds in m/s.
Spatial variability of the wind field contributed
to the differences noted between dual-Doppler wind speeds and the 300 m tower
wind speeds. This difference is illustrated in Figure 4 that displays the 100-m
dual-Doppler wind map over the time histories of the sonic anemometers mounted
at 100 m on the met tower. At 22:22 UTC (noted by the black vertical line
Figure 4, bottom), the 100 m sonic
wind speed dropped from near 10 m/s to just above 7 m/s as a transient lull
passed through the latticed tower. At a location just 100 m south of the tower
(noted by the black star in Figure 4, top),
the dual-Doppler measured that wind speeds remained near 9 m/s as the lull
passed just to the west of that location. Despite a few such anomalies due to
the propagation of boundary layer features, the dual-Doppler wind speed 100 m
south of the tower compared extremely well to the time histories of the sonic
anemometers.
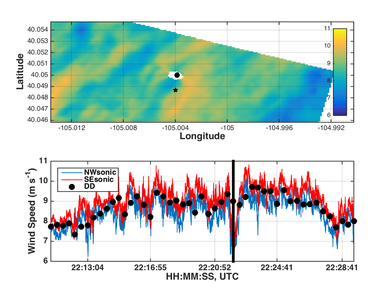 Figure 4. Truncated 100 m wind speed map at 22:22 UTC. (Top) The tower is indicated by the solid black circle, while data from the time history below is taken from the location indicated by the black star. (Bottom) Wind speed time histories from the 100 m sonic anemometers of the tower and the dual-Doppler wind speeds from the location indicated by the black star.
The dual-Doppler comparisons of April 2, 2015,
while only a small sample of the entire XPIA dataset, represent the results
obtained throughout the project. Comparisons between the dual-Doppler and sonic
anemometer wind speeds were excellent with correlation coefficients at above
0.90 for the analyzed datasets. Additional comparisons between the TTUKa
dual-Doppler data and a WindCube profiling lidar also yielded correlation
coefficients near and above 0.90. The strong agreement between the data from
the TTUKa radars and the other instrument platforms affirms the use of radar
technology as a reliable tool for wind assessment. A summary of these results,
and those of other instrument platforms that participated in XPIA, is
forthcoming in a technical report and submissions to academic journals.
Brian
Naughton, (505) 844-4033
Sandia Participates in the Second Annual Composites and Advanced Materials
Expo (CAMX)
Sandia Wind
Technologies Department materials lead, Brian Naughton, co-chaired a session
with Shridhar Nath of GE Global Research on composite material applications in
wind energy at the CAMX conference in Dallas, Texas, October 26–29, 2015. The
papers detailed a novel composite process model tailored to the challenges of
infusing large and thick composite wind blade components as well as the
development of a new lower-cost method to produce carbon fiber composite spar
caps using a pultrusion process. Other conference sessions featured
presentations from current and former graduate student researchers funded by
Sandia from Montana State University’s Composite Technologies Research Group on
topics ranging from natural fiber composites and digital image correlation for
enhanced composite material characterization, to modeling defects and damage
progression in composites—all with potential application to improving wind
energy composites. A half-day pre-conference tutorial introduced attendees to
composite structures joint design technology, an area of active research for
wind turbine blades as manufacturers look for solutions to the logistics
challenges of transporting increasingly larger blades from factory to field.
CAMX
featured hundreds of technical papers, educational sessions, and networking
events covering the full lifecycle and application space of composite materials.
Well attended by industry, academic, and government participants, the event
facilitated cross-industry interactions among those looking for new
opportunities to transfer capabilities and technologies developed for one
purpose to solutions in another area.
More
information on the recent conference can be found here.
Brian
Naughton, (505) 844-4033
Leading Edge Erosion Phase II Wind Tunnel Test
Begins
Wind tunnel testing is commencing for the second phase
of the leading edge erosion project, which is a collaboration between Texas
A&M, UC Davis, and Sandia. During
the 2012 fiscal year, Sandia, through its Blade Reliability Collaborative,
partnered with a wind turbine operator and associated wind turbine manufacturer
to study the effects of blade erosion on wind turbine power performance. As part of its aerodynamics research, Sandia
characterized the surface roughness caused by blade leading edge erosion,
quantified the performance degradation caused by erosion, and developed models
to predict the effects of the erosion on wind turbine energy capture. To achieve these aims, researchers used wind tunnel measurements and
companion modeling efforts to develop a predictive model of roughness-induced
boundary layer transition for wind energy applications.
This first phase of measurement and modeling focused
on an airfoil that is typically used on the tip region of a utility-scale wind
turbine blade, the NACA 64-418, which has a thickness to chord ratio of 18%. The aerodynamic characteristics of the
thicker airfoils located at the inboard region of a wind turbine blade are
significantly different than the characteristics of thinner, outboard
airfoils. There is a lack of critical
experimental data of the effect of roughness and erosion on thicker airfoils,
and collection of such data is needed to calibrate the model for application to
the inboard region of a blade. A second
phase of this research is underway to measure the aerodynamic performance of an
airfoil section model in a wind tunnel at conditions simulating those
encountered by the inboard region of a wind turbine blade. The SERI S814 airfoil, which has a thickness to chord
ratio of 24%, was selected for its desirable characteristics for code
validation and the availability of previously published transition data. The wind tunnel model’s
construction method, an innovative
multi-part process (see Figures 5 and 6, below), will enhance the ability to locate
transition using infrared thermography.
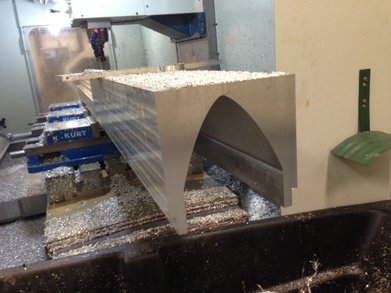 Figure 5. Machining the leading edge.
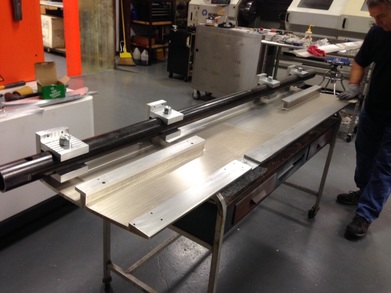 Figure 6. Assembled internal airfoil structure
The model construction is complete (see Figures 7 and 8), and the first wind tunnel test will be accomplished in December 2015.
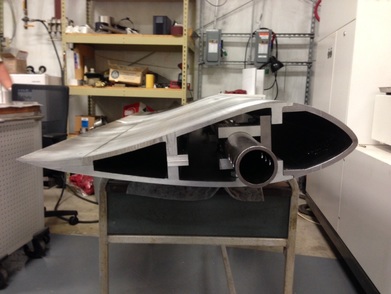 Figure 7. Complete airfoil model
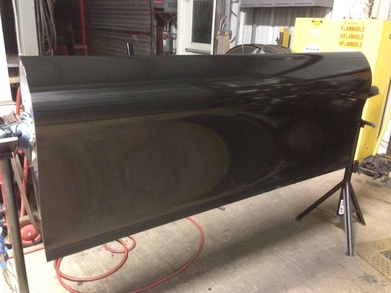 Figure 8. Finished surface of the airfoil model prior to mounting in the wind tunnel
David Maniaci, (505) 844-4663
2015 Wind Turbine Blade Manufacture Conference–Dusseldorf, Germany
The 2015 Wind Turbine Blade Manufacture Conference
was held in Dusseldorf, Germany, during the first week of December 2015 with
280 participants meeting in a single-session arrangement. Papers focused on the optimization of wind
blade designs, the use of advanced materials, long-term performance, and
innovations to improve production processes. Most presenters stressed the importance of
quality assurance measures, but only Sandia discussed nondestructive inspection methods (NDI) in its paper entitled “Use of Probability of
Detection Studies to Establish the Reliability of Quality Assurance Measures in
the Wind Industry.”
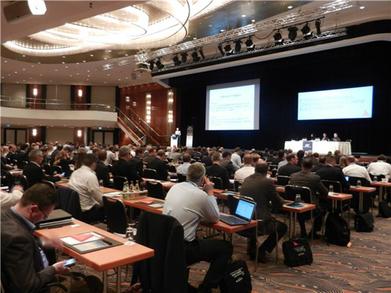 Figure 9. A session at the Wind Turbine Blade Manufacture conference
An extensive post-presentation question and answer session indicated significant interest in the topic. Subsequent discussions produced a number of contacts interested in learning more about Sandia’s NDI work and adopting advanced NDI practices. These contacts will provide outstanding support for Sandia’s ongoing work in NDI Tech Transfer and inspection method training. Following the conference, the first face-to-face meeting of the recently-formed IEA 35 Rotor Blade Committee was conducted. Operating under the auspices of the International Energy Agency, the Committee seeks to establish standards and guidelines for the performance testing and nondestructive inspection of wind blades.
Dennis Roach, (505) 844-6078
Water Power: Wave Energy
Dedication
of University of Maine’s W2 Ocean Engineering Laboratory
The University of Maine officially opened its
combined wind and wave (W2) experimental facility on November 23,
2015. The University of Maine partnered with Diana Bull (Sandia), Amy Robertson
(NREL), and Richard Kimball (Maine Maritime Academy) in the design and
development of this facility. W2
not only will allow for testing of offshore structures in scaled wave
conditions, but also will offer testing facilities for offshore wind conditions,
a significant addition to US testing capabilities.
The US Department of Energy (DOE)’s Water
Power Program will be the first to use the W2 facility in their
public prize challenge—the Wave
Energy Prize. W2
will act as one of five facilities producing 1/50th scaled wave
environments during the second phase of the competition.
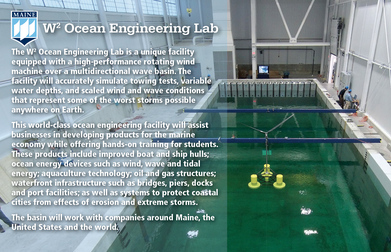 Figure 10. W2 Ocean Engineering Lab announcement
More information on the W2 facility can be found here.
Diana Bull,
(505) 284-5607
Phase 1 of WEC-Sim Experimental Testing Underway
As
part of the Wave Energy Converter SIMulator (WEC-Sim) project, Phase 1 of
WEC-Sim experimental testing is underway at Oregon State University’s (OSU)
Hinsdale Wave Research Laboratory. WEC-Sim is an open source code for modeling
the rigid-body dynamics and performance of wave energy converters in the
time-domain code. For more information about
the WEC-Sim code, refer to the WEC-Sim website at https://github.com/WEC-Sim/WEC-Sim/.
To validate the WEC-Sim code, the WEC-Sim team
is developing a numerical benchmarking data set resulting from experimental
testing of the Floating Oscillating Surge Wave Energy Converter (FOSWEC). The
FOSWEC, a heavily instrumented device, was selected as a benchmarking case for
WEC modeling based on the selection criteria detailed below, namely its ability
to increase modeling complexity by iteratively adding/removing degrees of
freedom, body-to-body interactions, and non-linear hydrodynamics.
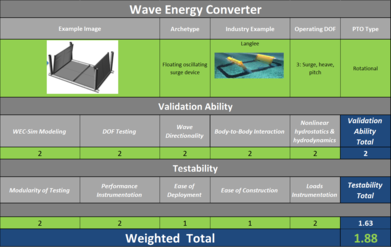 Figure 11. Selection criteria for the Floating Oscillating Surge Wave Energy Converter (FOSWEC)
The
FOSWEC and motion constraint (in lieu of a traditional mooring system) were
delivered to Hinsdale in early November 2015. After installation and
troubleshooting of the experimental setup, Phase 1 of WEC-Sim experimental
testing began on Nov. 30 at OSU Hinsdale in the Directional Wave Basin, with
completion scheduled for Dec 11, 2015.
Phase 2 testing is scheduled for spring 2016. An image from the first
week of WEC-Sim experimental testing is shown below.
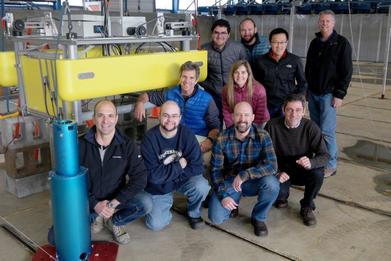 Figure 12. Delivery of the FOSWEC at Hinsdale Wave Research Laboratory for WEC-Sim experimental testing, team members (bottom left to top right): Enrique Gardeta (+D), Asher Simmons (OSU), Sean Moran (AC), Pedro Lomonaco (OSU), Peter van Tamalen (AC), Kelley Ruehl (Sandia), Carlos Michelen (Sandia), Yi-Hsiang Yu (NREL), Bret Bosma (OSU), Blake Walker (AC). Special thanks to team members not pictured: Chris Kelley, Giorgio Bacelli, and Budi Gunawan (Sandia) and Michael Lawson (NREL), and funding from DOE-EERE Water Power.
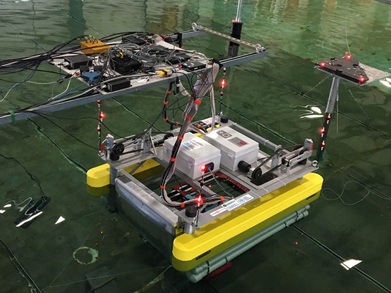 Figure 13. FOSWEC in the Hinsdale Directional Wave Basin during Phase 1 of WEC-Sim Experimental Testing
Kelley Ruehl, (505) 284-8724
Publication in Ocean Engineering
The Reference Model Project, supported by the
US Department of Energy, provides publicly available technical and economic
benchmarks for a variety of marine energy converters. This program supported the following
publication:
D.
Bull, “An improved understanding of the natural resonances of moonpools
contained within floating rigid-bodies: Theory and application to oscillating
water column devices,” Ocean Engineering, vol. 108, pp. 799–812, Nov.
2015. SAND2015-8229 J
Abstract: The fundamental interactions between waves,
a floating rigid-body, and a moonpool that is selectively open to atmosphere or
enclosed to purposefully induce pressure fluctuations are investigated. The
moonpool hydrodynamic characteristics and the hydrodynamic coupling to the
rigid-body are derived implicitly through reciprocity relations on an array of
field points. By modeling the free surface of the moonpool in this manner, an
explicit hydrodynamic coupling term is included in the equations of motion.
This coupling results in the migration of the moonpool’s natural resonance
frequency from the piston frequency to a new frequency when enclosed in a
floating rigid-body. Two geometries that highlight distinct aspects of marine
vessels and oscillating water column (OWC) renewable energy devices are
analyzed to reveal the coupled natural resonance migration. The power
performance of these two OWCs in regular waves is also investigated. The air
chamber is enclosed and a three-dimensional, linear, frequency domain
performance model that links the rigid-body to the moonpool through a linear resistive
control strategy is detailed. An analytic expression for the optimal linear
resistive control values in regular waves is presented.
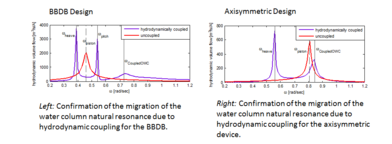 Figure 14. Graphs showing water column migration with BBDB design (left) and axisymmetric design (right).
This
article can be accessed here.
Diana Bull,
(505) 284-5607
Paper and presentation at OCEANS2015
Carlos
Michelen and Ryan Coe recently published results from research comparing
various methods for producing short-term (i.e. sea-state specific) extreme
response distributions. These methods are needed to statistically quantify the
extreme response (e.g., tension in the mooring line of a wave energy converter)
based on modeling results. (Note that these results might be obtained using
either a physical or numerical model.)
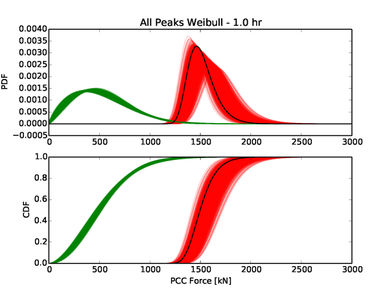 Figure 15. Distributions from all-peaks-Weibull method for a range of sea-state realizations. Green: Weibull fit of global peaks. Red: Estimated distribution of 1-hour extremes. Black: True distribution of 1-hour extremes.
The range of methods available to perform this task balance the amount of data required against the relevance of that data with respect to the extreme response. The comparison showed that the methods considered produce widely varying results; the researchers suggest that the Weibull-tail-fitting method offers an attractive combination of efficiency and performance.
C. Michelen, R. Coe, Comparison of methods for estimating short-term extreme response of wave energy converters, in: OCEANS, IEEE, Washington, D.C., 2015.
Ryan Coe, (505) 845-9064
DTOcean 4th General Meeting, Madrid, Spain (October 27–29, 2015)
Jesse
Roberts and Jason Heath of Sandia National Laboratories attended the 4th
General Meeting of Optimal Design Tools for Ocean Energy Arrays Project
(DTOcean) in Madrid, Spain, October 27–29, 2015. This project is developing a
whole-system software design tool for determining levelized cost of electricity
(LCOE) for the design and implementation of first generation wave and tidal energy
arrays. The DTOcean consortium, which includes 18 members from academia,
industry, a US national lab (Sandia), and three field site developers, is
positioned to develop and validate the whole-system tool. The components or
“modules” of the DTOcean Tool will assess the following: hydrodynamics, array
layouts, power output; electrical sub-systems; mooring, foundation and anchor
systems and designs; logistics for installation, operations, maintenance, and
reliability; economics; and environmental impact. The DTOcean Tool will
integrate and facilitate communication between the modules with the goal of
determining and optimizing LCOE.
At
two years into the three year project, with much development completed on the
individual modules, the meeting focused on two major items:
1)
better
understanding the inter-dependencies of the individual DTOcean modules; and
2)
identifying
a clear and acceptable path for completing the integration of the modules into
a single DTOcean Tool that comprises the best functionality and enables global
optimization for minimizing LCOE.
Day 1 included presentations to the strategic advisory board. The status and capabilities of the various modules were discussed. Mathew Topper of Tecnalia presented an initial version of the graphical user interface and demonstration of the DTOcean Tool, which highlighted how the tool may reveal controls on LCOE as a function of user-inputs or sensitivity analysis on decision variables (e.g., array spacing, foundation/anchor type and design, etc.). Days 2 and 3 involved many break-out sessions for team members working on individual modules. The sessions focused on finalizing the remaining calculation algorithms and data requirements needed for full assembly of the modules for the global calculation of an array design (including all components and maintenance requirements) and LCOE. The final group presentation discussed the strengths and limitations of optimization methods to that may be implemented to minimize LCOE as the goal, given constraints and decision variables that would be user-specified.
Jesse Roberts, (505) 844-5730
Jason Heath, (505) 845-1375
|