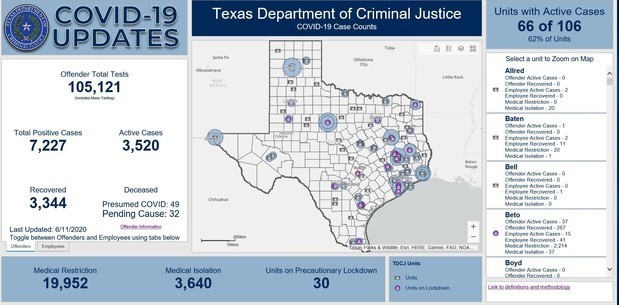
Figure 1. Texas Department of Criminal Justice COVID-19 dashboard.
This article was first published by the Response Geospatial Office. For more GIS articles, click here to subscribe.
COVID-19 hit some populations particularly hard: individuals in nursing homes, people who work in close proximity to each other in meat packing plants, and both the offenders and the officers in the criminal justice system. In Texas, the Department of Criminal Justice (TDCJ) chose to make their COVID-19 data open and available so everyone, the State’s leadership, the public, and their population’s family members, could have a full understanding of the situation.
We interviewed Karen Hall and Jason Clark from the TDCJ, along with their colleagues in the Texas Division of Emergency Management (TDEM), to learn not only how they created such a great interactive dashboard and website, but more significantly, how they had the foresight to allow their seemingly sensitive information to be publicly available. Their collaboration provides a great lesson to the GIS and emergency management community: know your audience’s information needs and make sure you build something they can use.
Importance of Transparency
Clark explained that very early into the event, TDCJ began to think about how their facilities would be affected. At first, they only had a handful of cases, but they knew there was the potential for spread. They quickly took a lot of precautions, which included PPE, but it also meant restricting the movement of their population. But, restricting movement has an impact on not just the incarcerated individual, but also their families: “When you impact lives you have to be as transparent as possible as to why you are taking those measures. We wanted to let everyone know: This is what we are doing and this is why.”
[Click to read more about the Texas Dashboard on the Analytics Hub]