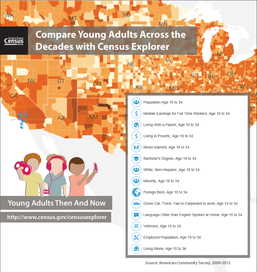
New Census Bureau Statistics Show How Young Adults Today Compare With Previous Generations in Neighborhoods Nationwide
|

![]()
 |
|
CONNECT WITH US ON SOCIAL MEDIA.
SUBSCRIBER SERVICES:
Unsubscribe | Remove me from All Subscriptions | Help
|
![]()
|
|
CONNECT WITH US ON SOCIAL MEDIA.
SUBSCRIBER SERVICES:
Unsubscribe | Remove me from All Subscriptions | Help