African-Born Population in U.S. Roughly Doubled Every Decade Since 1970, Census Bureau Reports
FOR IMMEDIATE RELEASE: WEDNESDAY, OCT. 1, 2014
African-Born Population in U.S. Roughly Doubled Every Decade Since 1970, Census Bureau Reports
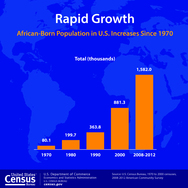
The foreign-born population from Africa
has grown rapidly in the United States during the last 40 years, increasing
from about 80,000 in 1970 to about 1.6 million in the period from 2008 to 2012,
according to a U.S. Census Bureau brief released today. The population has
roughly doubled each decade since 1970, with the largest increase happening
from 2000 to 2008-2012.
The
Foreign-Born Population from Africa: 2008-2012, a brief based on American Community Survey statistics,
shows that the African foreign-born population accounts for 4 percent of the
total U.S. foreign-born population. No African country makes up the majority of
these immigrants, but four countries — Nigeria, Ethiopia, Egypt and Ghana —
make up 41 percent of the African-born total.
“The brief — the Census Bureau’s first
focusing on the African foreign-born population — highlights the size, growth,
geographic distribution and educational attainment of this group,” said
Christine Gambino of the Census Bureau’s Foreign-Born Population Branch, who is
one of the brief’s authors. “We have found that the African-born population
tends to be more educated and accounts for a relatively large proportion of the
foreign-born population in some nontraditional immigrant gateway states such as
Minnesota and the Dakotas.”
The foreign-born population from Africa
had a higher level of educational attainment than the overall foreign-born
population: 41 percent of African-born had a bachelor’s degree or higher
compared with 28 percent overall. Within the foreign-born population from
Africa, educational attainment varied by place of birth. For example, 40
percent of the Somali-born population had less than a high school education,
while 64 percent of Egyptian-born individuals had a bachelor’s degree or
higher.
·The four states with African-born
populations over 100,000 were New York (164,000), California (155,000), Texas
(134,000) and Maryland (120,000).
·Of the 10 states with the largest
African-born populations, Minnesota (19 percent), Maryland (15 percent),
Virginia (9 percent), Georgia (8 percent) and Massachusetts (8 percent) had
percentages of African-born in their foreign-born populations that were at
least twice the national percentage of 4 percent.
·Metropolitan areas with the largest
African-born populations were New York (212,000), Washington (161,000), Atlanta
(68,000), Los Angeles (68,000), Minneapolis-St. Paul (64,000), Dallas-Fort
Worth (61,000) and Boston (60,000).
·Among the 10 metro areas with the
largest African-born populations, Nigerians were the most populous group and
constituted a high proportion (20 percent or more) of the African-born in the
Atlanta, Chicago, Dallas-Fort Worth and Houston metros.Similarly, Ethiopians were a high proportion
and the largest group in the Washington D.C. metro, Cabo Verdeans in Boston,
Somalis in Minneapolis-St. Paul, Egyptians in Los Angeles and Liberians in
Philadelphia.
About the American Community Survey
The information in this release comes from
data collected from the American Community Survey from 2008 to 2012. The questions asked
include:
·Where was this person born?
·Is this person a citizen of the
United States?
·When did this person come to live in
the United States?
Organizations use this information to
develop programs for refugees, immigrants and other foreign-born individuals.
Federal and state agencies require these statistics to support enforcement of
nondiscrimination policies and to allocate funds for school districts based on
limited English proficiency, immigrant, low income and minority student
populations.
Ever since Thomas Jefferson directed the
first census in 1790, the census has collected detailed characteristics about
our nation’s people. Questions about jobs and the economy were added 20 years
later under James Madison, who said such information would allow Congress to
“adapt the public measures to the particular circumstances of the community,”
and over the decades allow America “an opportunity of marking the progress of
the society.”
-X-
Note: Statistics from sample surveys are subject to
sampling and nonsampling error. All comparisons made in this report have been
tested and found to be statistically significant at the 90 percent confidence
level, unless otherwise noted. Please consult the tables for specific margins
of error. For more information, go to <http://www.census.gov/acs/www/data_documentation/documentation_main/>.
See <http://www.census.gov/acs/www/data_documentation/2012_release/> for
more information on changes affecting the 2008-2012 statistics. See
<http://www.census.gov/acs/www/guidance_for_data_users/comparing_2012/>
for guidance on comparing 2008-2012 American Community Survey statistics with
previous years.

