Census Bureau News -- Profile America Facts for Features -- Back to School: 2014-2015 (resend)
Census Bureau News -- Profile America Facts for Features -- Back to School: 2014-2015 (resend)
CB14-FF.20
July 24, 2014
Back to School: 2014-2015
By August, summertime will be winding down and vacations
will be coming to an end, signaling that back-to-school time is near. It’s a
time that many children eagerly anticipate — catching up with old friends and
making new ones, and settling into a new daily routine. Parents and children
alike scan newspapers and websites looking for sales on a multitude of school
supplies and the latest clothing fads and essentials. This edition of Facts
for Features highlights the many statistics associated with the return to
classrooms by our nation’s students and teachers.
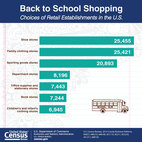
For
back-to-school shopping, choices of retail establishments abound: In 2012,
there were 25,421 family clothing stores, 6,945 children and infants clothing
stores, 25,455 shoe stores 7,443 office supply and stationery stores, 20,893
sporting goods stores, 7,244 book stores and 8,196 department stores. Source:
U.S. Census Bureau, 2012 County Business Patterns, NAICS: 448210, 44814,
448130, 453210, 451211 and 4521 <http://factfinder2.census.gov/bkmk/table/1.0/en/BP/2012/00A1//naics~44813|44814|448210|451211|4521|453210>
Students
78
million
The number of children and adults enrolled in school
throughout the country in October 2012 — from nursery school to college. They
comprised 26.4 percent of the entire population age 3 and older. Source: U.S. Census Bureau, School Enrollment – Social and
Economic Characteristics of Students: October 2012, Table 1 <http://www.census.gov/hhes/school/data/cps/2012/tables.html>
Pre-K through 12 Enrollment
76%
Percentage of children ages 3 to 6 enrolled in kindergarten
who attended all day, as of October 2012. Source: U.S. Census Bureau, School Enrollment – Social and
Economic Characteristics of Students: October 2012, Table 3 <http://www.census.gov/hhes/school/data/cps/2012/tables.html>
74%
Percentage of children 3 to 6 years old who were enrolled in
school as of October 2012. Source: U.S. Census Bureau, School Enrollment – Social and
Economic Characteristics of Students: October 2012, Table 3 <http://www.census.gov/hhes/school/data/cps/2012/tables.html>
25%
Percentage of elementary through high school students who
had at least one foreign-born parent in October 2012. Source: U.S. Census Bureau, School Enrollment – Social and
Economic Characteristics of Students: October 2012, Table 1 <http://www.census.gov/hhes/school/data/cps/2012/tables.html>
Languages
12 million
Number of school-age children (5 to 17) who spoke a language
other than English at home in 2012; 8.6 million of these children spoke Spanish
at home. Source: U.S. Census Bureau, 2012 American Community Survey <http://factfinder2.census.gov/bkmk/table/1.0/en/ACS/12_1YR/B16004>
Colleges
14%
Percentage of college students 35 and older in October 2012.
They made up 32 percent of those attending school part time. Source: U.S. Census Bureau, School Enrollment – Social and
Economic Characteristics of Students: October 2012, Table 5 <http://www.census.gov/hhes/school/data/cps/2012/tables.html>
41%
Percentage of 18- to 24-year-olds enrolled in college in 2012. Source: U.S. Census Bureau, School
Enrollment – Social and Economic Characteristics of Students: October 2012,
Table 1 <http://www.census.gov/hhes/school/data/cps/2012/tables.html>
Work Status
52%
Percentage of students enrolled in
college who worked less than full time, year-round in 2011; 20 percent worked full time,
year-round. Source: School Enrollment and Work
Status: 2011, Appendix Table 1-A <http://www.census.gov/prod/2013pubs/acsbr11-14.pdf>
3.1 million
Number of enrolled high school
students who worked less than full time, year-round in 2011; 146,000 students
in high school worked full time, year-round. Source: School Enrollment and Work
Status: 2011, Appendix Table 1-A <http://www.census.gov/prod/2013pubs/acsbr11-14.pdf>
Field of Degree
12.5
million
Number of people age 25 and over
who held a bachelor’s degree in business in 2012. Business degrees were
reported by 20.5 percent of the population with a bachelor’s degree, followed
by education (13.5 percent); science—and engineering—related fields (9.1
percent); engineering (7.8 percent); social sciences (7.7 percent); biological,
agricultural and environmental sciences (6.2 percent); other (5.3 percent); liberal
arts and history (5.0 percent); psychology (4.7 percent); literature and
languages (4.4 percent); computers, mathematics and statistics (4.2 percent); visual and
performing arts (4.1 percent); communications (3.7 percent); and physical and
related sciences (3.3 percent). Source: U.S. Census Bureau, 2012 American Community Survey <http://factfinder2.census.gov/bkmk/table/1.0/en/ACS/12_1YR/B15010>
Average earnings of full-time,
year-round workers 18 and older with an advanced degree (bachelor’s degree
or higher) in 2012. Workers whose highest degree was a bachelor’s had mean
earnings of $70,432. Mean earnings for full-time, year-round workers with a
high school diploma (includes GED certificate) was $41,248, while workers with
less than a ninth grade education had $26,679 average earnings. Source: Income, Poverty, and Health
Insurance Coverage in the United States: 2012, Series P60-245 <http://www.census.gov/hhes/www/cpstables/032013/perinc/pinc04_000.htm>
Following is a list of observances typically covered by the
Census Bureau’s Facts for Features series:
Black
History Month (February) Labor
Day
Super
Bowl Grandparents
Day
Valentine’s
Day (Feb. 14)Hispanic
Heritage Month (Sept. 15-Oct.15)
Women’s
History Month (March)Unmarried Single
Americans Week
St. Patrick’s Day (March 17)American
Indian/Alaska Native Heritage
Earth
Day (April 22)Month (November)
Older
Americans Month (May)Asian/Pacific
American Heritage Month
Cinco
de Mayo (May 5)(May)
Mother’s
Day Veterans Day (Nov. 11)
Hurricane
Season Begins (June 1)Thanksgiving
Day
Father’s
Day The
Holiday Season (December)
The
Fourth of July (July 4)
Anniversary
of Americans with Disabilities Act (July 26)
Back
to School (August)
Editor’s note: The preceding data were collected
from a variety of sources and may be subject to sampling variability and other
sources of error. Facts for Features are customarily released about two months
before an observance in order to accommodate magazine production timelines.
Questions or comments should be directed to the Census Bureau’s Public
Information Office: telephone: 301-763-3030; or e-mail: <pio@census.gov>.