Interactive Apportionment Map Now Available

Interactive Apportionment Map Now Available

Apportionment Data Viz

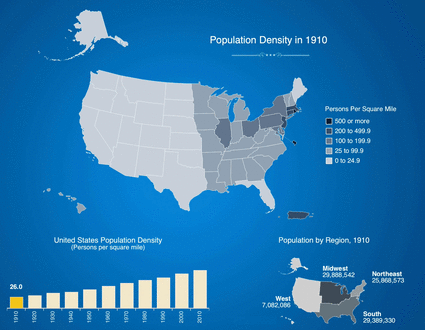
The U.S. Census Bureau launched a new online map today ahead of the 2020 Census apportionment results release. The “Historical Apportionment Data Map” currently displays apportionment results for each census from 1910 to 2010. 2020 Census apportionment results will be added to the map as they become available.

Interactive Map

The interactive map includes the following types of data for each census from 1910 to 2010:

  • Number of seats in the U.S. House of Representatives
  • Changes to each state’s number of seats in the U.S. House of Representatives
  • Population per representative for each state
  • Resident population of each state
  • Percentage change in resident population for each state
  • Population density of each state

Help us spread the word about Census Bureau data.

Share this on social media or forward it to a friend.

Share This


Apportionment 101

Every 10 years, population counts from the decennial census determine how many seats each state gets in the U.S. House of Representatives.

This process, called apportionment, is one of the most important uses of census results because it impacts your voice in Congress.

Learn more in our Apportionment 101 fact sheet. Download it in English or one of 13 other languages and share it!

Download


Apportionment FAQs

  • What is apportionment?
  • Who is included in the apportionment population counts?
  • How is the apportionment calculated?
  • What is the difference between apportionment and redistricting?

Visit our website for answers to some of the most frequently asked questions.

Get Answers