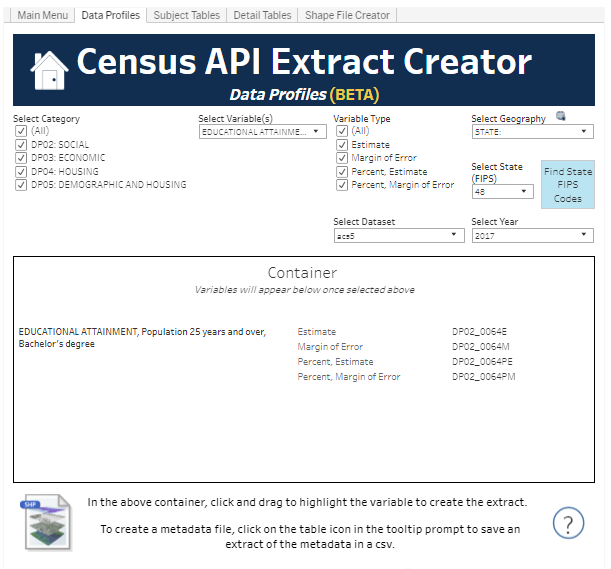
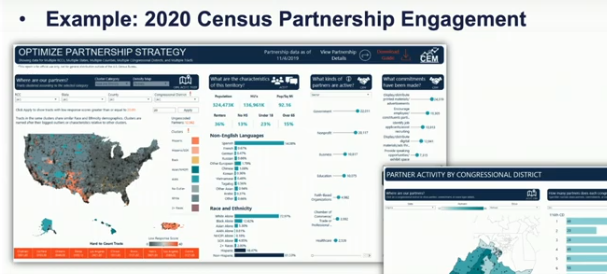
The Data That Powers Our Democracy Can Also Power Your Visualization
Data Viz Newsletter
The Census Bureau serves as the leading source of quality data about the nation's people and economy. See how we're using Census data to build innovative visualizations and data tools.
Introducing the Beta Version of the Census API Extract Creator
This unique interactive platform allows you to compose an API call that extracts the selected 5-Year American Community Survey (ACS) variables from the most recent release. The data points come from Data Profile, Subject, and Detailed Profile tables representing over 135,000 variables.
Note: This visualization works best with the Chrome browser on a laptop or desktop.
Featured Data Visualizations
Some of our data visualizations were featured in a gallery installation at the Tableau Conference 2019. Others were featured in a presentation by the Census Bureau's Data Visualization team.
Breweries in the United States
Not a single U.S. state saw a decline in the overall number of breweries between 2012 and 2016.
Time for a Grocery Run!
Dig deeper into Economic Census data to learn more about products sold in your state.
2020 Census Complete Count Committees
See our map of Complete Count Committees across the nation and sign up today.
Getting Ready for 2020
The 2020 Census is less than one year away. We’re embedding analytics and designing dashboards to help propel the culture of data-driven decision making, as we ask for your support to embark on the largest federal mobilization to conduct the next decennial count. Learn more about different ways to partner with us and join our developer community.
More than 900 people in the data visualization community attended the Census Bureau's session. And more than 20,000 attendees saw the Census Bureau brand at the opening of the conference.
Discover ways to create informative geospatial maps, along with methods of tapping into the socioeconomic and demographic characteristics via census.gov and our API.