|
|
|
Data Viz Newsletter
We're Bringing Census Data to Life
 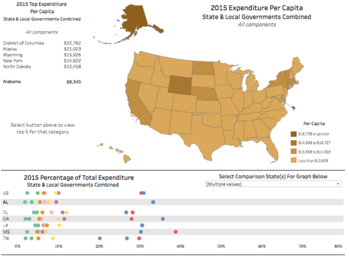 State and Local Government Snapshot: Expenditures and Employment
Use this tool to explore aggregated revenue, expenditure, and employment data for State and Local Governments. Customize the view by using the drop-down menus, and selectable category buttons. Receive additional information by hovering over each data element.
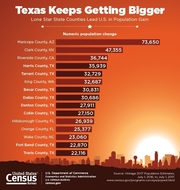
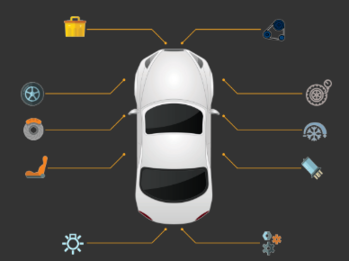 Motor Vehicle Manufacturing in America
This interactive data visualization changes gears to explore the value of product shipments for selected motor vehicle parts. To begin, hover over each image icon and click to see the corresponding shipment values in the table.
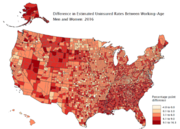
 Video: From Pyramids to Pillars
The United States is an aging country. Already there are more middle-aged people than children and, in just a few decades, we project that older adults will outnumber kids for the first time in U.S. history. But the country’s population did not always look like this. What did it look like in 1860 and how has it changed across the decades?
Stay Tuned for More Census Data
Thanks for reading this month's Data Viz Newsletter. Our team is hard at work to bring you the best in data visualization and data science training materials. Next month, we'll be shining a spotlight on economic data from the Census Bureau.
|
|
|
|
|
Do More With Census Data
We're here to help you get the most out of Census Bureau data. Visit Census.gov to access free data science training, webinars, and video tutorials. You can also connect with our network of Data Specialists, State Data Centers, and Regional Offices.
If you like our data visualizations, use the hashtag #CensusData to share them on social media. Share this message or view it as a web page.
|