PROFILE AMERICA FACTS FOR FEATURES: CB17-FF.08
APRIL 10, 2017
After a meeting with the National Council of Senior
Citizens, President John F. Kennedy encouraged all Americans to pay tribute to
older people across the country by designating May 1963 as Senior Citizens
Month. Every president
since has issued a formal proclamation during or before the month of May in
support of older Americans. In 1980, President
Jimmy Carter issued a proclamation changing the name of this observance to
Older Americans Month. This month continues to be a time to celebrate the age 65
and older population through ceremonies, events and public recognition.
Population
47.8 million
The number of people age 65 and older in the United States
on July 1, 2015. This group accounted for 14.9 percent of the total population.
The age 65 and older population grew 1.6 million from 2014. Source: Vintage 2015 Population Estimates www.factfinder.census.gov/faces/tableservices/jsf/pages/productview.xhtml?pid=PEP_2015_PEPAGESEX&prodType=table
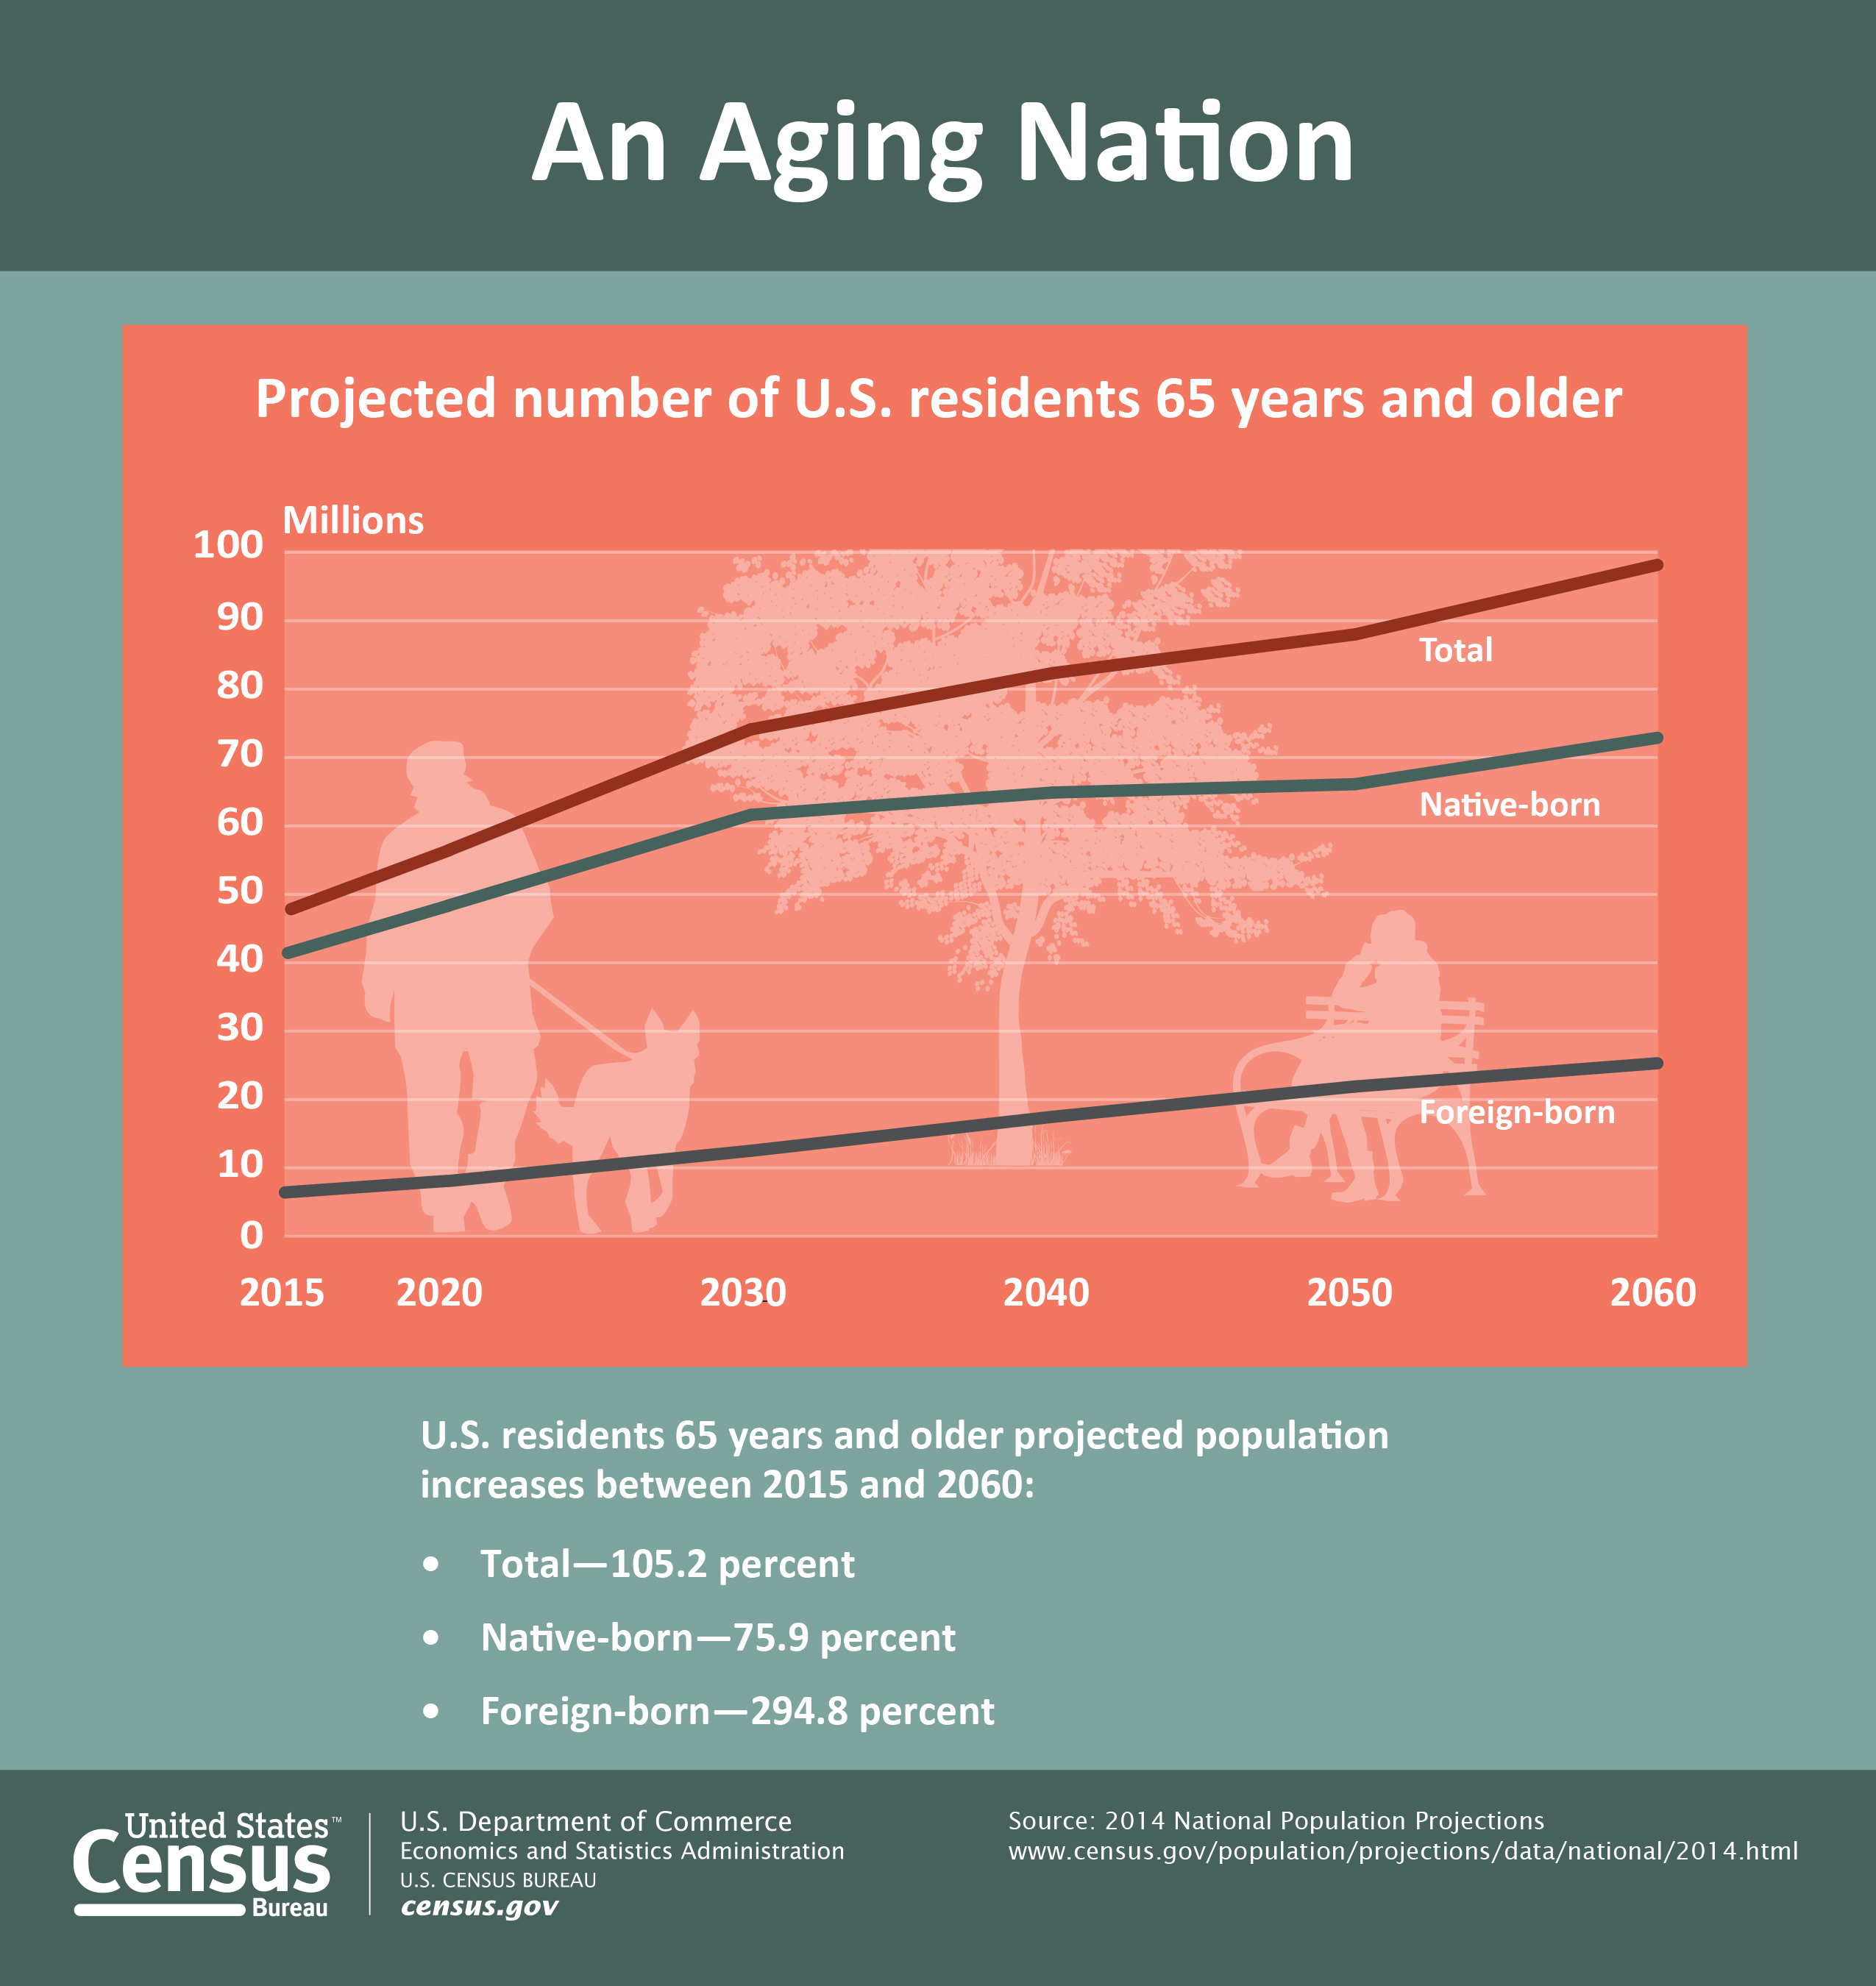
98.2 million
The projected population of people age 65 and older in 2060.
People in this age group will comprise nearly one in four U.S. residents. Of
this number, 19.7 million will be age 85 or older. Source: 2014 National Population Projections, Table 3 www.census.gov/population/projections/data/national/2014/summarytables.html
Income and
Poverty
$38,515
The median income of households with householders age 65
and older in 2015. Source: Income and Poverty in the United States: 2015,
Table 1 www.census.gov/content/dam/Census/library/publications/2016/demo/p60-256.pdf
8.8%
The
percentage of people age 65 and older in poverty in 2015, down from 10.0
percent in 2014. Source:
Income and Poverty in the United States: 2015, Table 3 www.census.gov/content/dam/Census/library/publications/2016/demo/p60-256.pdf
$170,516
The
median net worth for householders age 65 and older in 2011. Source:
Survey of Income and Program Participation, Net Worth and Asset Ownership of
Households: 2011 www.census.gov/topics/income-poverty/wealth.html
13.7%
The supplemental poverty rate for those age 65 or older,
equating to 6.5 million people in 2015. Excluding Social Security from income
would more than triple the poverty rate for this group. Source: The Supplemental Poverty Measure: 2015, Table 2 www.census.gov/library/publications/2016/demo/p60-258.html
Serving Our
Nation
9.3 million
The estimated number of U.S. veterans age 65 and older in
2015. Source: 2015 American Community Survey, Table B21001 www.factfinder.census.gov/faces/tableservices/jsf/pages/productview.xhtml?pid=ACS_15_1YR_B21001
Jobs
4.6
million
The number of men age 65 and older in the
labor force in 2015. There were 3.7 million women age 65 and older in the labor
force in 2015. Source: 2015 American Community Survey, Table B23001 www.factfinder.census.gov/faces/tableservices/jsf/pages/productview.xhtml?pid=ACS_15_1YR_B23001&prodType=table
5.3 million
The number of full-time, year-round
workers age 65 and older with earnings in 2015. Source: Current Population Survey, Historical Income Tables: People, Table P-32 www.census.gov/data/tables/time-series/demo/income-poverty/historical-income-people.html>
Business Owners
15.6%
The estimated
percentage of business owners in respondent firms with and without paid
employees in 2012 who were age 65 and older. Source: 2012 Survey
of Business Owners, Table SB1200CSCBO08 www.factfinder.census.gov/faces/tableservices/jsf/pages/productview.xhtml?pid=SBO_2012_00CSCBO08&prodType=table
13.2%
The estimated percentage
of women business owners in respondent firms with and without paid employees in
2012 who were age 65 and older. Source: 2012 Survey of
Business Owners, Table SB1200CSCBO08 www.factfinder.census.gov/faces/tableservices/jsf/pages/productview.xhtml?pid=SBO_2012_00CSCBO08&prodType=table
Education
82.8%
The percentage of the population age 65 and older in 2015 who
had completed high school or higher education. Source: 2015 American Community Survey, Table S1501 www.factfinder.census.gov/bkmk/table/1.0/en/ACS/15_1YR/S1501
25.8%
The percentage of the population age 65 and older in 2015
who had earned a bachelor’s degree or higher. Source: 2015 American Community Survey, Table S1501 www.factfinder.census.gov/bkmk/table/1.0/en/ACS/15_1YR/S1501
Marital Status and Living Arrangements
57.8%
The percentage of the population
age 65 and older in 2016 who are married. Source: Families and Living Arrangements: 2016, Table A1 www.census.gov/hhes/families/data/cps2016A.html
24.0%
The percentage of the population age
65 and older in 2016 who are widowed. Source: Families and Living
Arrangements: 2016, Table A1 www.census.gov/hhes/families/data/cps2016A.html
Computer and Internet Use
35.3 million
The number of responders age 65
and older who reported living in homes with computers in 2015. This is an
increase from 2014 (32.9 million). Additionally, 30.9 million accessed the
internet through a high-speed internet connection in 2015, up from 28.8 million
in 2014. Source: 2015 American Community Survey, Table B28005 www.factfinder.census.gov/faces/tableservices/jsf/pages/productview.xhtml?pid=ACS_15_1YR_B28005&prodType=table
Voting
59.4%
The percentage of citizens age 65 and older who reported
casting a ballot in the 2014 elections. Source:
Voting and Registration in the Election of
November 2014, Table 2 www2.census.gov/programs-surveys/cps/tables/p20/577/table02_1.xls
Homeownership
79.5%
The percentage of householders age 65 and older who owned
their homes as of fourth quarter 2016. Source: Current Population Survey/Housing Vacancy Survey, Historical
Table 19 www.census.gov/housing/hvs/data/histtabs.html
Services
for the Older Population
4,815
The number of continuing care retirement communities in 2012.
These businesses employed 423,627 people and generated $27.6 billion in
revenues. In 2007, there were 5,373 such establishments, employing 416,402
people and generating $24.7 billion in revenues. These establishments provide a
range of residential and personal care services with on-site nursing care
facilities for the elderly and other people who are unable to care for
themselves, and the elderly and other people who do not desire to live
independently. Individuals live in a variety of residential settings with
meals, housekeeping, social, leisure and other services available to assist
residents in daily living. Source: 2012 Economic Census Geographic Area Series, Table
EC1200CCOMP1
www.factfinder.census.gov/faces/tableservices/jsf/pages/productview.xhtml?pid=ECN_2012_US_00CCOMP1&prodType=table
25,964
The number of business establishments providing services for the elderly and
people with disabilities in 2012. These businesses employed 901,359 people and
generated $34.1 billion in revenues. In 2007, there were 20,433 such
establishments, employing 621,545 people and generating $25.3 billion in
revenues. These establishments provide nonresidential social assistance
services to improve the quality of life for the elderly, persons diagnosed with
intellectual and developmental disabilities, or persons with disabilities. Senior
citizens centers are among the establishments in this industry. Source: 2012 Economic Census Geographic Area Series, Table EC1200CCOMP1
www.factfinder.census.gov/faces/tableservices/jsf/pages/productview.xhtml?pid=ECN_2012_US_00CCOMP1&prodType=table
Geography
19.4%
The
percentage of Florida’s population age 65 and older in 2015, followed by Maine (18.8 percent).
Alaska had the lowest percentage (9.9 percent) followed by Utah (10.3 percent). Source:
Vintage 2015 Population
Estimates www.census.gov/newsroom/press-releases/2016/cb16-107.html
54.8%
The percentage of the
population in Sumter, Fla., age 65 and older in 2015, which led all of the nation’s
counties. Source: Vintage 2015 Population Estimates www.census.gov/newsroom/press-releases/2016/cb16-107.html
118,891
The estimated population of The Villages, Fla., metro area on
July 1, 2015. The Villages, a metro area located to the west of the Orlando
metro area, was the nation’s fastest-growing metro area between July 1, 2014,
and July 1, 2015, with its population increasing by 4.3 percent. The metro area
is home to one of the largest age-restricted retirement communities
in the world. Source: Vintage 2015 Population Estimates www.census.gov/newsroom/press-releases/2016/cb16-43.html
www.factfinder.census.gov/faces/tableservices/jsf/pages/productview.xhtml?src=bkmk
Centenarians
53,364
The number of people age 100 and older counted by the 2010
Census. In 2010, over half (62.5 percent) of the 53,364 centenarians were age
100 or 101. Source:
Centenarians: 2010, Figure 1 www.census.gov/prod/cen2010/reports/c2010sr-03.pdf
20.7
The number of centenarian men in 2010 for every 100
centenarian women. Source: Centenarians: 2010, Page 3 www.census.gov/prod/cen2010/reports/c2010sr-03.pdf
43.5%
The percentage of centenarian men who lived with others in
a household in 2010, the most common living arrangement for this group. For
their female counterparts, the most common living arrangement was residing in a
nursing home (35.2 percent). Source: Centenarians: 2010, Figure 4 www.census.gov/prod/cen2010/reports/c2010sr-03.pdf
3.3
The number of centenarians per 10,000 people in North
Dakota in 2010. North Dakota was the only state with more than three
centenarians per 10,000 people. Source: Centenarians: 2010, Table 2 www.census.gov/prod/cen2010/reports/c2010sr-03.pdf
Following is a
list of observances typically covered by the Census Bureau’s Facts for Features series:
African-American History Month
(February) Labor Day (1st
Monday in September)
Super Bowl (first Sunday in February) Grandparents Day (1st
Sunday after Labor Day)
Valentine’s Day (Feb. 14) Hispanic
Heritage Month (Sept. 15-Oct. 15)
Women’s History Month (March) Unmarried and
Single Americans Week (3rd week of
September)
Irish-American Heritage Month
(March)/ Halloween
(Oct. 31)
St. Patrick’s Day (March 17) American
Indian/Alaska Native Heritage Month
Earth Day (April 22) (November)
Asian/Pacific American Heritage Month
(May) Veterans Day (Nov. 11)
Older Americans Month (May) Thanksgiving
Day (4th Thursday in November)
Mother’s Day (2nd Sunday in May) The Holiday Season (December)
Hurricane Season Begins (June 1)
Father’s Day (third Sunday in June)
The Fourth of July (July 4)
Anniversary of Americans with
Disabilities Act (July 26)
Back to School (August)
Editor’s note: The preceding data were collected from a variety of sources and may be
subject to sampling variability and other sources of error. Facts for Features
are customarily released about two months before an observance in order to
accommodate magazine production timelines.
-X-
Graphic | JPG | PDF |
Nadine Huntley-Hall
Public Information
Office census.gov
301-763-3030 / pio@census.gov Connect
with us on Social media
| 