NEWS RELEASE: CB16-139
Workers Earn Almost Twice As Much As Other
Occupations
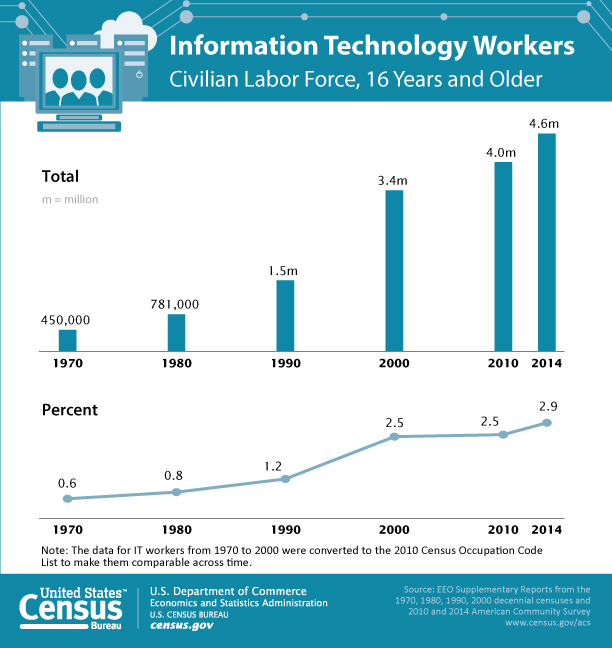
AUG. 16, 2016 — The number of
information technology (IT) workers now stands at 4.6 million, compared with
just 450,000 in 1970 according to a new report from the U.S. Census Bureau’s
American Community Survey. This upsurge means that IT workers now represent 2.9
percent of the U.S. labor force.
“The Census Bureau first identified IT occupations in the 1970 Census,” Julia Beckhusen said, a senior
economist in the Census Bureau’s Industry and Occupation Statistics Branch. “At
that time, there were only three IT occupation categories. That number grew to
12 by 2010 as the variety of work continued to increase.”
IT workers
are more likely to be men, and on average, they earn more than their female
counterparts do ($82,370 median earnings compared with
$72,035). The
proportion of women in IT occupations peaked at 31 percent in 1990 and declined
to 25 percent in 2014. In comparison, the proportion of women in all
occupations has increased over time, from 38 percent in 1970 to 47 percent in
2014.
Median annual earnings of IT occupation workers were
$80,665 in 2014, or almost twice as much as the median earnings of the total
workforce in 2014.
The median earnings, adjusted for inflation, for both men
and women in IT occupations rose between 1970 and 2014. In contrast, male
workers in the overall workforce experienced earnings declines, while median
earnings for women rose.
The highest earning IT occupations were computer and
information research scientists, software developers, applications and system
software, computer and information systems managers, and computer network
architects, each with median earnings of $90,000 or more. A higher share of workers
in these occupations also had advanced degrees. For instance, 52 percent of computer
and information research scientists had at least a master’s degree. Additionally,
22 percent of IT workers had a master’s degree or higher compared with 12
percent for all workers.
IT
workers were twice as likely to work at home as all workers (10 percent
compared with 4 percent). Web developers had the highest rate (20 percent) of
working at home, compared with other IT occupations. Moreover, web developers
had among the highest rates of self-employment (21 percent).
IT workers also tend to be younger. More than half (55
percent) were between the ages of 25 and 44 compared with 43 percent of all
workers. Within the IT occupations, web developers were among the youngest with
38 percent between the ages of 25 and 34 and 11 percent between the ages of 16
and 24.
These statistics come from the Occupations
in Information Technology report that uses
statistics from decennial censuses and the American Community
Survey to explore trends and characteristics of IT workers and describes the
growth and increasing complexity of the IT workforce in the United States
during the past half century.
Other
highlights:
·
In
2014, 18 percent of IT workers were Asian compared with 6 percent of all
workers.
·
Software
developers, applications and systems software is the largest IT occupation,
accounting for 25 percent of all IT workers.
·
Database
administrators had among the highest percentage of women (38 percent) but also
had among the largest wage gap between men and women where men’s median
earnings were $86,855 compared with $56,890 for women.
·
IT
workers had a higher percentage of full-time, year-round workers at 87 percent
versus 69 percent of the total employed.
·
IT
occupations had a higher rate of foreign-born workers, 24 percent compared with
17 percent of total employed. Looking at the largest IT occupation, software
developers, applications and systems software, 39 percent were foreign-born.
About
the American Community Survey
The American
Community Survey is the only source of small area estimates for social
and demographic characteristics of the U.S. population. It gives communities
the current information they need to plan investments and services. Retailers,
homebuilders, police departments, and town and city planners are among the many
private- and public-sector decision makers who count on these annual results.
Visit the ACS
helps communities page to see some examples.
These statistics would not be possible without the
participation of the randomly selected households in the survey.
-X-
Blog
Graphic | JPG
| PDF
|
Public Information
Office census.gov
301-763-3030 / pio@census.gov Connect
with us on Social media
| 