Native
Hawaiians and Other Pacific Islanders
1.5 million
Estimated number of U.S. residents
in 2014 who were Native Hawaiian or Other Pacific Islander alone or in
combination. Source:
Vintage 2014 Population Estimates http://factfinder.census.gov/bkmk/table/1.0/en/PEP/2014/PEPSR5H?slice=Year~est72014
369,688
Estimated number of Hawaii residents
in 2014 who were Native Hawaiian or Other Pacific Islander, alone or in
combination — the most of any state. California followed with 347,501. Hawaii
also had the largest portion of its population being Native Hawaiian or Other
Pacific Islander alone or in combination at 26.0 percent. Source:
Vintage 2014 Population Estimates http://factfinder.census.gov/bkmk/table/1.0/en/PEP/2014/PEPSR5H?slice=Year~est72014
555,208
Number of
Native Hawaiians in the U.S. in 2014. The Native Hawaiian population was the
largest detailed Native Hawaiian and Other Pacific Islander (NHPI) group,
followed by Samoan (194,564) and Guamanian or Chamorro (133,569). These
estimates represent the number of people who reported a specific detailed NHPI
group alone, as well as people who reported that detailed NHPI group in
combination with one or more other detailed NHPI groups or another race(s). Source:
2014 American Community Survey, Table B02019 http://factfinder.census.gov/bkmk/table/1.0/en/ACS/14_1YR/B02019
Income, Poverty
and Health Insurance
$55,296
Median income of households headed by
Native Hawaiians and Other Pacific Islanders alone or in combination in 2014. Source: 2014 American Community Survey, Table S0201 http://factfinder.census.gov/bkmk/table/1.0/en/ACS/14_1YR/S0201//popgroup~060
18.4%
Poverty rate in 2014 of the
Native Hawaiian and Other Pacific Islanders alone or in combination population.
Source: 2014 American Community Survey, Table S0201 http://factfinder.census.gov/bkmk/table/1.0/en/ACS/14_1YR/S0201//popgroup~060
11.0%
Percentage without health insurance in
2014 for Native Hawaiians and Other Pacific Islanders alone or in
combination. Source: 2014 American Community Survey, Table S0201 http://factfinder.census.gov/bkmk/table/1.0/en/ACS/14_1YR/S0201//popgroup~060
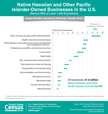
Business
54,749
Estimated number of Native Hawaiian and
Other Pacific Islander-owned firms in 2012. The estimated number rose 45.3
percent from 37,687 in 2007. Source: 2012 Survey of Business
Owners-Native Hawaiian and Other Pacific Islander-Owned Firms: 2012 http://census.gov/newsroom/press-releases/2015/cb15-209.html and http://factfinder.census.gov/bkmk/table/1.0/en/SBO/2012/00CSA01
52.9%
Estimated percent of the nation’s
Native Hawaiian and Other Pacific Islander-owned firms that were in either
California or Hawaii in 2012 (with 14,446 and14,537 firms, respectively). Source: 2012 Survey of Business
Owners-Native Hawaiian and Other Pacific Islander-Owned Firms: 2012-Native
Hawaiian and Other Pacific Islander-Owned Firms: 2012 http://census.gov/newsroom/press-releases/2015/cb15-209.html and http://factfinder.census.gov/bkmk/table/1.0/en/SBO/2012/00CSA01
24,982
Estimated number of Native Hawaiian and
Other Pacific Islander firms owned by women in 2012. Estimated 20.8 percent
(5,206 firms) were in the Health Care and Social Assistance services sector. Source: 2012 Survey of Business Owners-Native
Hawaiian and Other Pacific Islander-Owned Firms: 2012 http://factfinder.census.gov/bkmk/table/1.0/en/SBO/2012/00CSA01
Education
20.9%
Percentage of Native Hawaiians and Other Pacific
Islanders alone or in combination age 25 and older who had a bachelor’s degree
or higher in 2014. This compared with 30.1 percent for the total population. Source: 2014 American Community Survey, Table S0201 http://factfinder.census.gov/bkmk/table/1.0/en/ACS/14_1YR/S0201//popgroup~060 and http://factfinder.census.gov/bkmk/table/1.0/en/ACS/14_1YR/S0201
88.0%
Percentage of Native Hawaiians and Other Pacific
Islanders alone or in combination age 25 and older who had at least a high
school diploma in 2014. Source: 2014 American Community Survey, Table S0201 http://factfinder.census.gov/bkmk/table/1.0/en/ACS/14_1YR/S0201//popgroup~060
and http://factfinder.census.gov/bkmk/table/1.0/en/ACS/14_1YR/S0201
6.6%
Percentage of Native Hawaiians and Other Pacific
Islanders alone or in combination age 25 and older who had obtained a graduate
or professional degree in 2014. This compared with 11.4 percent for the total population this age. Source: 2014 American Community Survey, Table S0201 http://factfinder.census.gov/bkmk/table/1.0/en/ACS/14_1YR/S0201//popgroup~060 and http://factfinder.census.gov/bkmk/table/1.0/en/ACS/14_1YR/S0201
Serving Our
Nation
7.1%
Percentage of Native Hawaiian and Other
Pacific Islanders alone or in combination who were military veterans. Source: 2014 American Community Survey,
Table S0201 http://factfinder.census.gov/bkmk/table/1.0/en/ACS/14_1YR/S0201//popgroup~060
Jobs
29.8%
Proportion of civilian employed Native
Hawaiians and Other Pacific Islanders alone or in combination 16 and older who
worked in management, business, science and arts occupations in 2014.
Additionally, 26.2 percent worked in sales and office occupations, while 22.9 percent worked
in service occupations; 12.6 percent worked in production, transportation and
material moving occupations; and 8.5 percent worked in natural resources,
construction and maintenance occupations. Source: 2014 American Community
Survey, Table S0201 http://factfinder.census.gov/bkmk/table/1.0/en/ACS/14_1YR/S0201//popgroup~060
Age
Distribution
27.7
Median age of the Native Hawaiian and
Other Pacific Islander alone or in combination population in 2014. The median
age was 37.7 for the population as a whole. Source: 2014 American Community Survey, Source: Vintage 2014 Population Estimates, Table
PEPASR5H http://factfinder.census.gov/bkmk/table/1.0/en/PEP/2014/PEPASR5H?slice=year~est72014
33.0%
Percentage of the Native Hawaiian and
Other Pacific Islander alone or in combination population that was under age 18
in 2014, while 6.4 percent was 65 or older. Source: Vintage
2014 Population Estimates, Table PEPASR5H
http://factfinder.census.gov/bkmk/table/1.0/en/PEP/2014/PEPASR5H?slice=year~est72014
Following is a
list of observances typically covered by the Census Bureau’s Facts for
Features series:
African-American
History Month (February) Labor
Day (1st Monday in September)
Super
Bowl (first Sunday in February) Grandparents
Day (1st Sunday after Labor Day)
Valentine’s
Day (Feb. 14) Hispanic
Heritage Month (Sept. 15-Oct. 15)
Women’s
History Month (March) Unmarried
and Single Americans Week (3rd week of September)
Irish-American
Heritage Month (March)/ Halloween
(Oct. 31)
St. Patrick’s Day (March 17) American
Indian/Alaska Native Heritage Month
Earth
Day (April 22) (November)
Asian/Pacific
American Heritage Month (May) Veterans
Day (Nov. 11)
Older
Americans Month (May) Thanksgiving
Day (4th Thursday in November)
Mother’s
Day (2nd Sunday in May) The
Holiday Season (December)
Hurricane
Season Begins (June 1)
Father’s
Day (third Sunday in June)
The
Fourth of July (July 4)
Anniversary
of Americans with Disabilities Act (July 26)
Back
to School (August)
-X-
Graphic 1: JPG |PDF
Graphic 2: JPG |PDF
Public Information
Office census.gov
301-763-3030
/ pio@census.gov Connect with us
on Social
media
Editor’s
note: As
a matter of policy, the Census Bureau does not advocate the use of the alone
population over the alone-or-in-combination population or vice
versa. The use of the alone population in sections of this report does
not imply that it is a preferred method of presenting or analyzing data. The
same is true for sections of this report that focus on the alone-or-in-combination
population. Data on race can be presented and discussed in a variety of
ways.
The
preceding data were collected from a variety of sources and may be subject to
sampling variability and other sources of error. Facts for Features are
customarily released about two months before an observance in order to
accommodate magazine production timelines.
| 