Update from Tony Hill,
Interim Director of Public Health
09 February 2021

Dear headteachers,
Welcome to the weekly update of public health data for children and young people. The below graph is also attached here for ease and shows case numbers for age groups from 0-19, up to February 3, 2021.
|
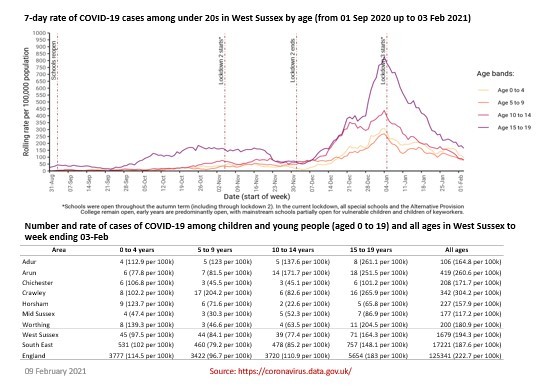 This week’s figure shows that:
- Rates of COVID-19 are continuing to fall in all age groups under 20 from the peak seen in early January
- However, rates among under 20s are still above those reported at the end of lockdown 2 (2nd December)
- Rates among children and young people aged under 20 are currently highest in 15 to 19 year olds and lowest among 10 to 14 year olds
Notes on the figure: the figure shows the rolling 7-day rate (per 100,000) of cases of COVID-19 among children and young people aged under 20, by 5-year age bands in West Sussex. We have chosen to cover the period from the 1 September 2020 when many settings reopened, until the most recent 7-day period we have data for.
This week, the table shows that:
- Rates among 0 to 19 year olds in West Sussex continue to be lower than the rate for all ages combined locally and nationally
- The rates among 0 to 19 age groups are broadly similar to those for the same age groups in the South East and England
- The rates among 5 to 9s and 10 to 14 year olds in West Sussex are lower than the rate for 0 to 4 year olds, however these do represent relatively small numbers
- Among under 20s, 15 to 19 year olds have the highest rate, particularly in Adur, Arun and Crawley (although counts are small)
Notes on the table: data in the table show numbers and rates of cases of COVID-19 among children and young people under 20 and across all ages in the most recent 7-day period (taking account of a built in time lag). Using rates as well as absolute numbers enables comparison across areas with different population sizes.
For example: the table shows that there were 1,679 new cases of COVID-19 in West Sussex in the most recent week, a rate of 194 per 100,000. There is substantial variation within the county, with the highest rate currently in Crawley (304 per 100,000) and the lowest in Mid Sussex (117 per 100,000). Rates allow more accurate comparison between areas as they take into account that population sizes vary.
However, it is also important to bear in mind that the further populations are broken down into small sub groups (such as five year age bands and/or district and boroughs), the smaller the numbers involved. Sometimes very small differences in numbers can create large differences in rates.
Best regards
Tony Hill

|