Update from Tony Hill,
Interim Director of Public Health
19 January 2021

Dear headteachers,
Welcome to the weekly update of public health data for children and young people. The below graph is also attached here for ease.
|
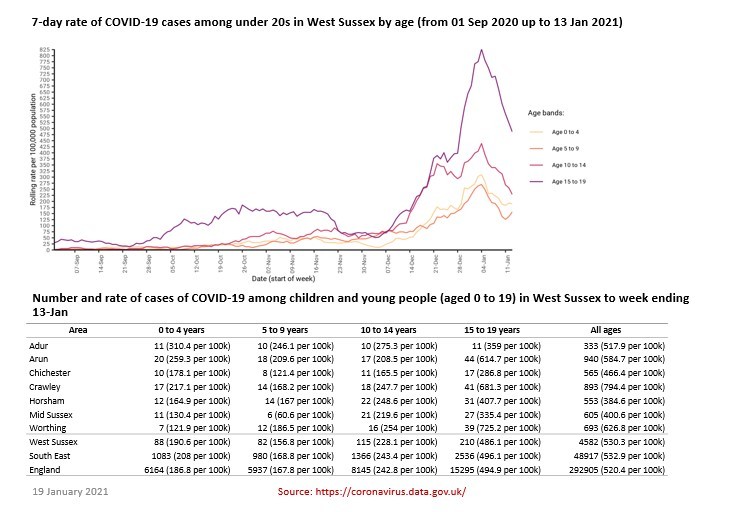 This week’s figure shows that:
- Rates in this age group continue to be highest in 15 to 19 year olds
- Following sharp increases in all age groups from early December, which we think is attributable to the new variant of Covid, rates have generally been falling in under-20s since the first week of January
- However, in the last few days there has been a slight rise in rates among 5 to 9 year olds. Rates in 0 to 4s also appear to be increasing, although to a lesser extent. More data is needed to establish if these are trends
Notes on the figure: the figure shows the rolling 7-day rate (per 100,000) of cases of COVID-19 among children and young people, by 5-year age bands. We have chosen to cover the period from the 1 September 2020 when many settings reopened, until the most recent 7 day period we have data for.
This week, the table shows that:
- Rates in 15-19s are particularly high in Crawley, Arun and Worthing. However these do represent relatively small numbers
- Rates among 0 to 19s are lower than the rate for all ages locally and nationally
- Rates for West Sussex are similar to the England average
Notes on the table: data in the table show numbers and rates of cases of COVID-19 among children and young people under 20 and across all ages in the most recent 7-day period (taking account of a built in time lag). Using rates as well as absolute numbers enables comparison across areas with different population sizes.
For example: the table shows that there were 4582 new cases of COVID-19 in West Sussex in the most recent week, a rate of 530 per 100k. This was similar to the rates in the South East, but slightly higher than the England rate (520 per 100k). Rates allow more accurate comparison between areas as they take into account that population sizes vary.
However, it is also important to bear in mind that the further populations are broken down into small sub groups (such as five year age bands), the smaller the numbers involved. Sometimes very small differences in numbers can create large differences in rates.
Best regards
Tony Hill

|