|
To have your content included on our next newsletter or to provide any feedback, please get in touch with us at: equalities@ons.gov.uk
Inclusive Data Taskforce
Last October, the National Statistician convened an independent Inclusive Data Taskforce, comprised of a diverse group of senior academics and civil society leaders with a breadth of expertise. Chaired by Dame Moira Gibb, the Taskforce was challenged to develop a set of recommendations that would create a step-change in the inclusivity of the UK’s data and evidence base.
Join us for the Inclusive Data Taskforce Report launch on Tuesday 28 September (10-11:30am) to discover more about the Taskforce’s recommendations, the National Statistician’s response, and our future plans.
|
Census 2021
As a result of factors such as the coronavirus (COVID-19) pandemic and Brexit, the UK is facing rapid societal change. More than ever, our priority is to deliver timely and accurate statistics, that enable the understanding of that change to inform decision making and service provision. On 13 July 2021, the Office for National Statistics launched a public consultation outlining our proposals for the content design and shape of the release plans for Census 2021 outputs. The aim of this consultation is to obtain an updated view of your detailed needs for Census 2021 data and analysis, and to understand your priorities. Your feedback will help us to make decisions on the final design of the Census 2021 outputs and analysis for England and Wales.
The consultation will remain open until midnight on 5 October 2021. We recommend you respond to the consultation in our online questionnaire. You can also download a word version of the questionnaire from the consultation webpage and email your response to census.outputs@ons.gov.uk.
|
Equalities related publications
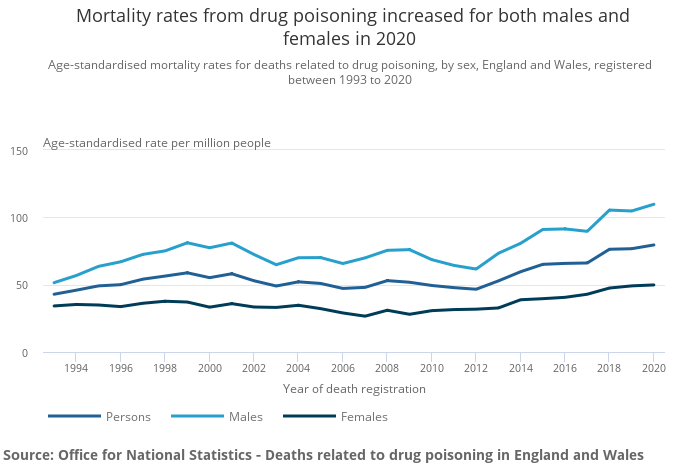
Deaths related to drug poisoning in England and Wales: 2020 registrations
This bulletin looked at deaths related to drug poisoning in England and Wales from 1993 to 2020, by cause of death, sex, age and substances involved in the death. In 2020, 4,561 deaths related to drug poisoning were registered in England and Wales (equivalent to a rate of 79.5 deaths per million people); this is 3.8% higher than the number of deaths registered in 2019 (4,393 deaths; 76.7 deaths per million). Males accounted for more than two-thirds of registered drug poisonings in 2020 (3,108 male deaths compared with 1,453 female deaths), consistent with previous years.
 Conceptions in England and Wales: 2019
This bulletin looked at annual statistics on conceptions to residents of England and Wales, with numbers and rates by age group including women aged under 18 years. In 2019, there were an estimated 821,089 conceptions to women of all ages in England and Wales compared with 839,043 in 2018, a decrease of 2.1%; this was the largest annual decrease since 2012. The conception rate for women under 18 years decreased from 16.8 conceptions per 1,000 women in 2018 to 15.8 in 2019; this is in line with the recent trend of a decreasing under-18 conception rate since 2007 where it stood at 41.6. For the fourth consecutive year, women aged 40 years and over were the only age group to see an increase in conception rates; in 2019, there were 16.7 conceptions per 1,000 women aged 40 years and over, continuing the generally increasing trend seen since 1990 when records began.
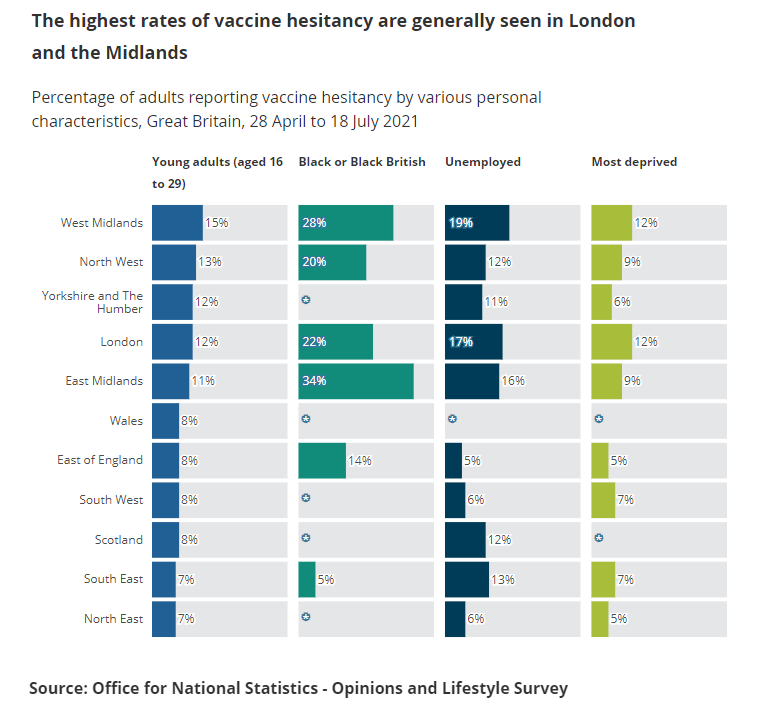
Coronavirus and vaccine hesitancy, Great Britain: 9 August 2021
This release looked at hesitancy towards a coronavirus (COVID-19) vaccine, based on the Opinions and Lifestyle Survey (OPN) covering the period 23 June to 18 July 2021. Additional analysis examines hesitancy in areas of Great Britain between 7 January to 28 March and 28 April to 18 July 2021. Vaccine hesitancy appeared to have decreased slightly among the youngest age groups compared with the previous period. Black or Black British adults had the highest rates of vaccine hesitancy (21%) compared with White adults (4%). Vaccine hesitancy was higher for adults identifying Muslim (14%) or Other (14%) as their religion, compared with adults who identify as Christian (4%). This linked article noted in line with trends observed across Great Britain as a whole, young adults, those of Black or Black British ethnicity, and the unemployed are generally the most hesitant towards vaccines in all English regions, Scotland and Wales.
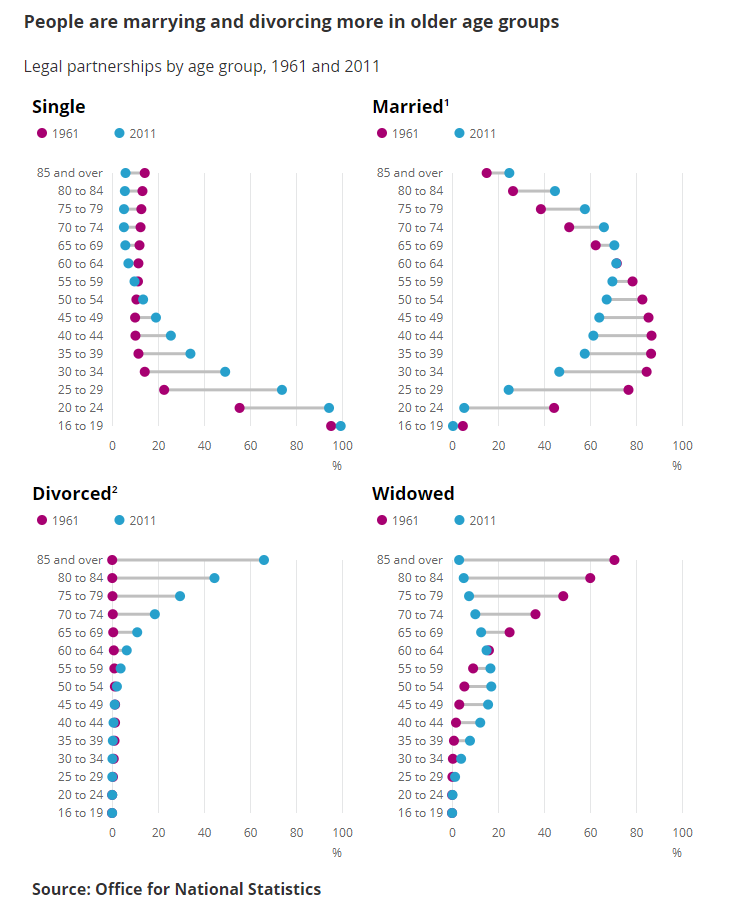
 Census unearthed: explore 50 years of change from 1961
This article explored how life in England and Wales changed dramatically between 1961 and 2011, from the homes we live in, to our relationships and everyday amenities. From having an inside toilet to how many of us are married, newly digitised data show how the ways we live changed from 1961 to 2011. At the time of the 1961 Census, 68% of people aged 16 years and over were married and 0.8% were divorced. In the 2011 Census, this had changed to 49% of people aged 16 years and over married or in a same-sex civil partnership, and 9% divorced or in a legally dissolved civil partnership. Censuses are snapshots, so they can’t tell us how many times someone has been married or in a civil partnership but the differences between these figures for 1961 and 2011 reflect a period of stark social change. By 2011, divorce law had become less stringent, civil partnerships for same-sex couples had existed for six years and people who were separated but legally married could record this on the census, options that were not available in 1961. To allow comparison between years, this analysis has included separated but legally married people as “married” in 2011.
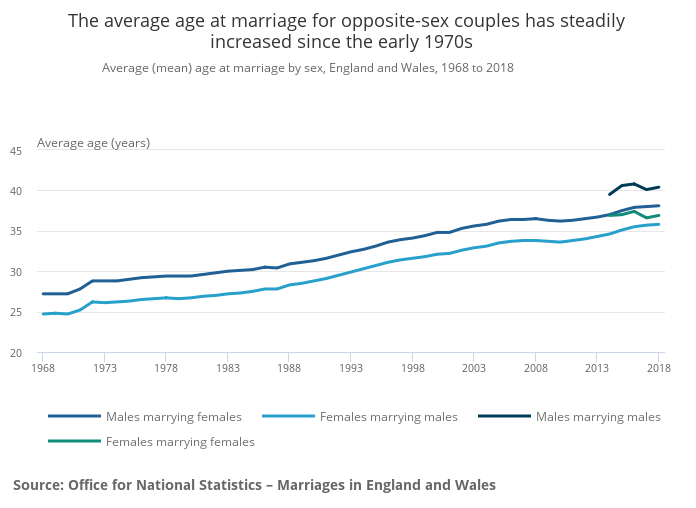
 Marriages in England and Wales: 2018
This bulletin looked at the number of marriages that took place in England and Wales analysed by age, sex, previous marital status and civil or religious ceremony. There were 234,795 marriages in England and Wales in 2018; a decrease of 3.3% compared with 2017 and the lowest since 2009. Marriage rates for opposite-sex couples in 2018 were the lowest on record, with 20.1 marriages per 1,000 unmarried men and 18.6 marriages per 1,000 unmarried women. In 2018, there were 6,925 marriages between same-sex couples, with 57.2% between female couples; a further 803 same-sex couples converted their civil partnership into a marriage. Around one fifth (21.1%) of opposite-sex marriages in 2018 were religious ceremonies, the lowest on record; in contrast, religious ceremonies accounted for only 0.9% of same-sex marriages. In 2018, the average age at marriage for opposite-sex couples was 38.1 years for men and 35.8 years for women; for same-sex couples the average ages at marriage were 40.4 years and 36.9 years respectively.
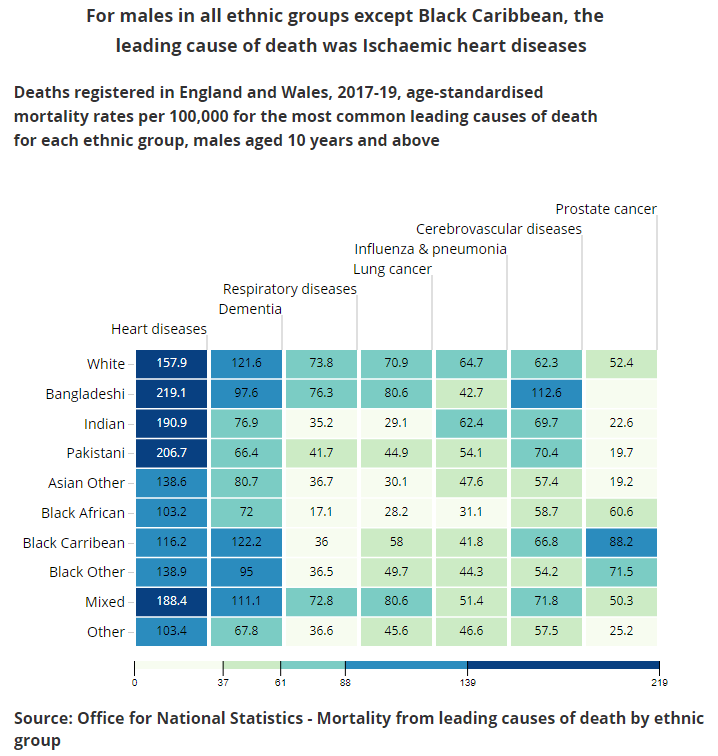
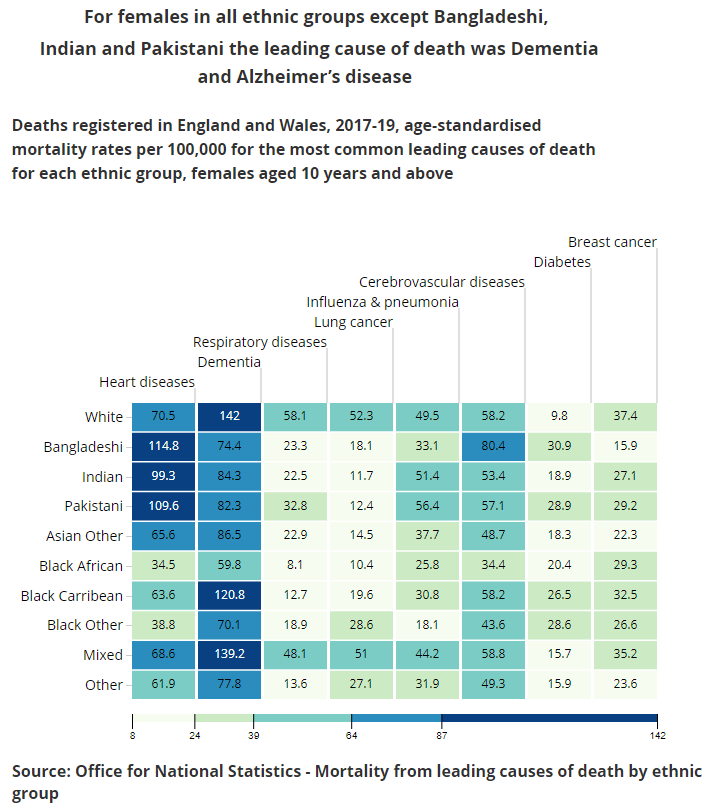
 Mortality from leading causes of death by ethnic group, England and Wales: 2012 to 2019
These experimental statistics provided analysis of ethnic differences in mortality and cause-specific mortality in England and Wales based on 2011 Census and death registrations. The results reveal important patterns in causes of death between ethnic groups that are complex but nevertheless consistent with most previous studies; further research is required to investigate the reasons for the differences, with potential explanations including past migration patterns, socio-economic composition of the groups, health-related behaviours, and clinical and biological factors. Looking at the most common causes of death, ischaemic heart disease featured for all ethnic groups, and the highest age-standardised mortality rates (ASMRs) across time have been in the Bangladeshi, Pakistani and Indian ethnic groups. The White, Mixed, and Black Caribbean ethnic groups had the highest dementia and Alzheimer’s disease ASMRs. Suicide rates in males were highest in the White and Mixed ethnic groups than all other ethnic groups, and in females rates were highest in the Mixed ethnic groups than all other ethnic groups.
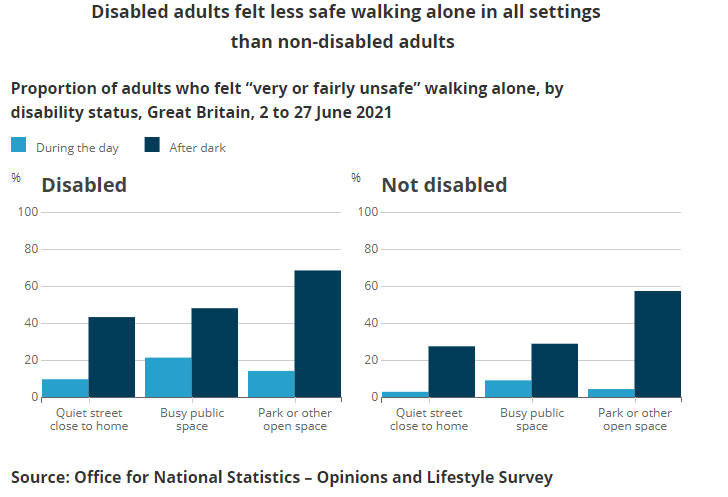
  Perceptions of personal safety and experiences of harassment, Great Britain: 2 to 27 June 2021
This bulletin looked at perceptions of safety and experiences of harassment, by personal characteristics, based on the Opinions and Lifestyle Survey (OPN). The analysis found that one in two women and one in seven men felt unsafe walking alone after dark in a quiet street near their home. Disabled people (those with a physical or mental health condition or illness that has lasted, or is expected to last, 12 months or more that reduces their ability to carry out day-to-day activities) felt less safe walking alone in all settings than non-disabled people. When looking at sex and age together, women aged 16 to 34 years and 75 years and over felt less safe in most settings than females in other age groups. Differences were significant, both during the day and after dark, “in a quiet street close to home” and “in a busy public place” (see accompanying datasets).
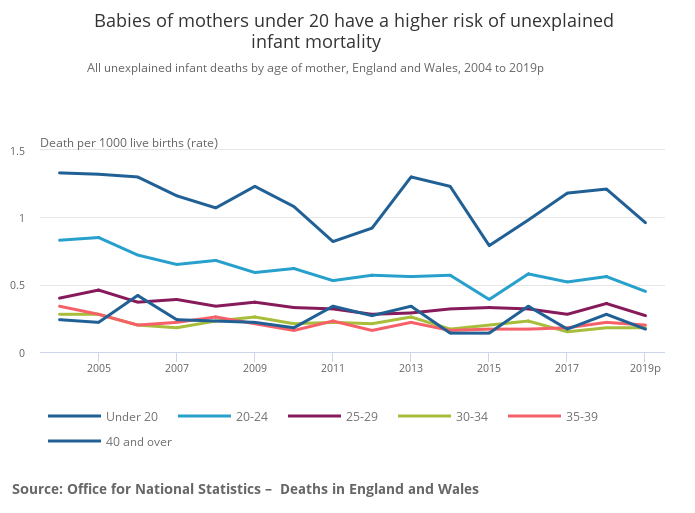
 Unexplained deaths in infancy, England and Wales: 2019
This release provided annual data on sudden infant deaths in England and Wales and infant deaths for which the cause remained unascertained after a full investigation, with associated risk factors. There were 170 unexplained infant deaths accounting for 7.1% of all infant deaths in England and Wales in 2019. The unexplained infant mortality rate had been decreasing since records began in 2004 but has levelled out since 2014 and was 0.27 deaths per 1,000 live births in 2019. Mothers aged under 20 are over five times more likely to experience unexplained infant deaths than mothers aged over 40.
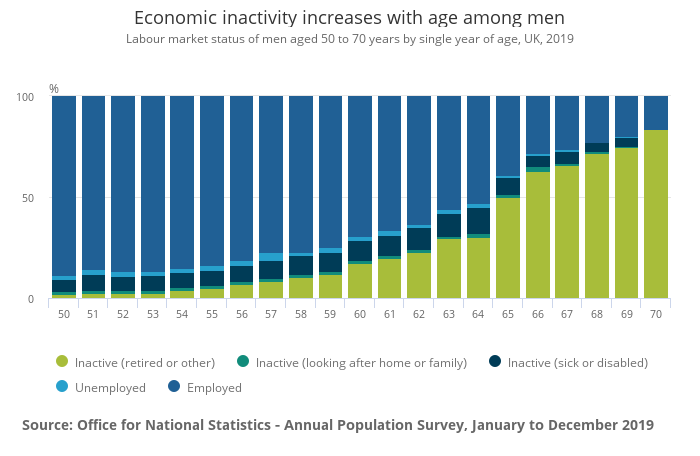
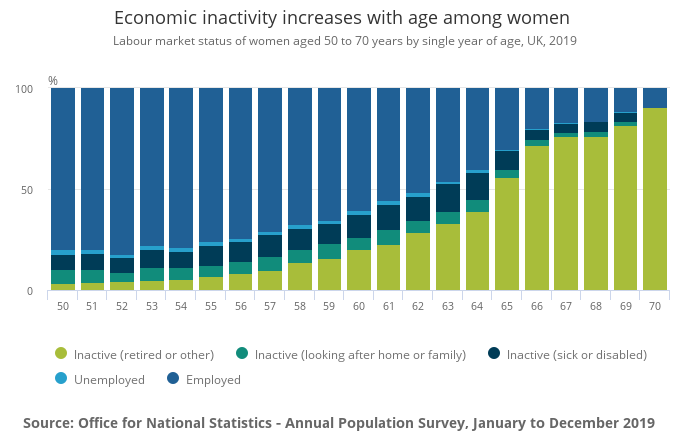
 Living longer: impact of working from home on older workers
This article examined if the shift towards working from home seen during the coronavirus (COVID-19) pandemic may help enable older workers to remain in the labour market for longer. Early exit of older workers from the UK labour market, between the age of 50 years and prior to State Pension age (SPA), can negatively impact an individual's future financial security and is also detrimental to the wider economy. Previous research has shown that flexible working is a factor in enabling older workers to remain in the labour market for longer; in June and July 2020, older workers working entirely from home were more likely to say they were planning to retire later compared with those not working from home. Women are far more likely to be economically inactive prior to State Pension age (SPA) than men at all older ages. At age 50 years, 17.9% of women were economically inactive compared with 9.6% of men and at age 64 years, 58.6% of women compared with 44.9% of men.
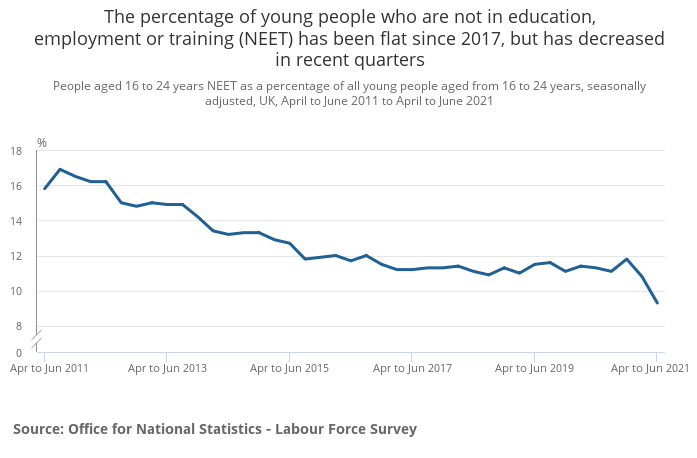
  Young people not in education, employment or training (NEET), UK: August 2021
This release explored estimates of young people (aged 16 to 24 years) who are not in education, employment or training, by age and sex. There continues to be a strong fall in the number of people aged 16 to 24 years who are not in education, employment or training (NEET), driven largely by those aged 18 to 24 years; there is a rise in young people in full time education whilst the total number of young people is decreasing, these factors have contributed to the fall we observed in recent periods. In April to June 2021, an estimated 9.3% of all people aged 16 to 24 years were not in education, employment or training (NEET), a record low for the series which began in October to December 2001. The proportion decreased on the quarter by 1.5 percentage points, and decreased by 2.0 percentage points compared with April to June 2020. An estimated 9.8% of men were NEET, and for women the proportion was a record low of 8.7%.
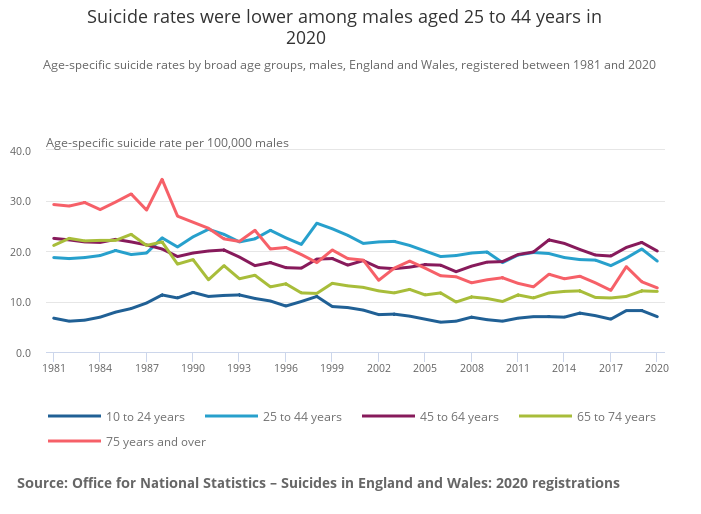
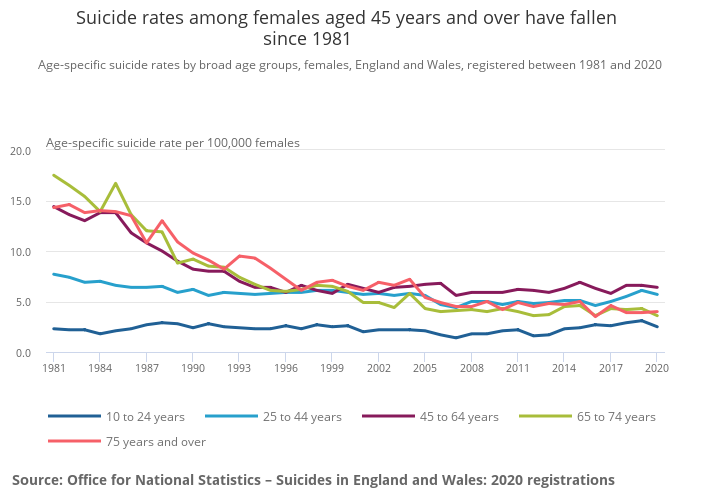
 Suicides in England and Wales: 2020 registrations
This bulletin looked at registered deaths in England and Wales from suicide analysed by sex, age, area of usual residence of the deceased and suicide method. In 2020, there were 5,224 suicides registered in England and Wales, equivalent to an age-standardised mortality rate of 10.0 deaths per 100,000 people and statistically significantly lower than the 2019 rate of 11.0 deaths per 100,000. The decrease is likely to be driven by two factors; a decrease in male suicides at the start of the coronavirus (COVID 19) pandemic, and delays in death registrations because of the pandemic. The England and Wales male suicide rate of 15.4 deaths per 100,000 is statistically significantly lower than in 2019 but consistent with rates in earlier years; for females, the rate was 4.9 deaths per 100,000, consistent with the past decade. Males and females aged 45 to 49 years had the highest age-specific suicide rate (24.1 male and 7.1 female deaths per 100,000).
|