|
www.coventry.gov.uk/infoandstats
In this issue:

Source: Insight, Coventry City Council
In this edition, we are spotlighting one of the local area profiles. See the infographic below for a snapshot of some of the key findings in Canley.
The Joint Strategic Needs Assessment (JSNA) brings together evidence about the health and wellbeing of Coventry residents, to help leaders across health and care understand and work together to improve the health and wellbeing of the people of Coventry.
The Insight team has developed localised reports that capture what life is like in different parts of Coventry. These reports celebrate the strengths within each community while also highlighting challenges. They are informed by data, statistics, community feedback and on the ground experiences in these neighbourhoods.
To learn more, read the full report on Canley.
|
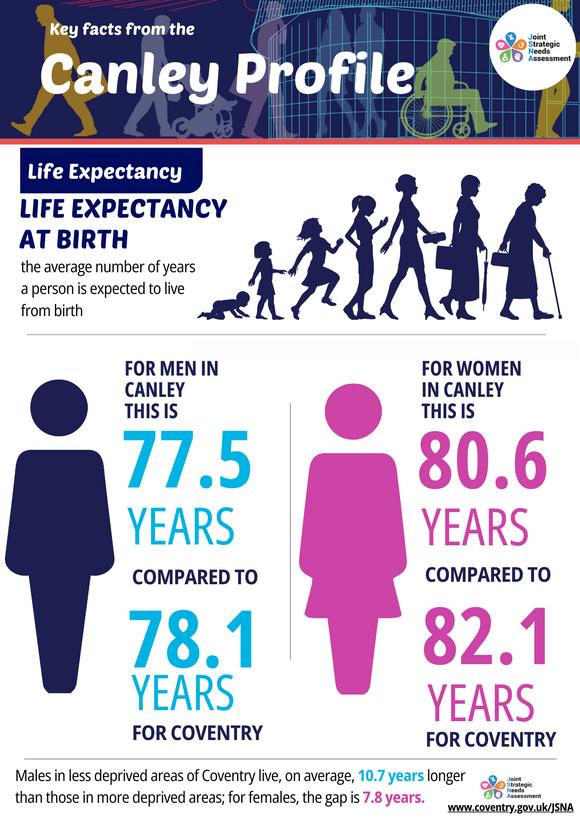
Life expectancy at birth - the average number of years a person is expected to live from birth.
For men in Canley this is 77.5 years, compared to 78.1 years for Coventry. For women in Canley is 80.6 compared to 82.1 years for Coventry.
Males in less deprived areas of Coventry live, on average, 10.7 years longer than those in more deprived areas; for females, the gap is 7.8 years.
Source: Office for National Statistics (ONS)
The Office for National Statistics (ONS) has published an interactive tool “Which towns attract people with advanced education”. Using this tool you can explore how many people stayed in Coventry after gaining qualifications or where the students from Coventry ended up after gaining qualifications. This tool uses the data related to all state school pupils in England who sat their GCSEs between 2007 to 2008 and 2010 to 2011 school years.
In this tool, people who went on to gain degree level qualifications are referred to as “graduates” and people who are non graduates with advanced qualifications referred as “qualified non graduates”.
According to this tool, in Coventry:
- Out of 14,655 state funded pupils who sat their GCSEs, 31% became graduates and 29% became qualified non graduates. These rates are about average for all English areas.
- Of those from Coventry, 75% of graduates and 84% of qualified non graduates were still living in the city in 2018-19 after achieving their qualifications.
- Overall, Coventry ended up with:
- a similar number of graduates as it produced
- a similar number of non-graduates with advanced qualifications as it produced
You can read more about the trends seen across England in this ONS article: Geographical mobility of young people across English towns and cities.
Source: Office for National Statistics (ONS)
The Office for National Statistics has published an analysis of consumer card spending trends covering what UK card holders are spending money on and how this changes across the UK. The average spend per cardholder increased by 17% between June 2019 to June 2023. Online spending increased during the pandemic and remains higher than the pre pandemic levels.
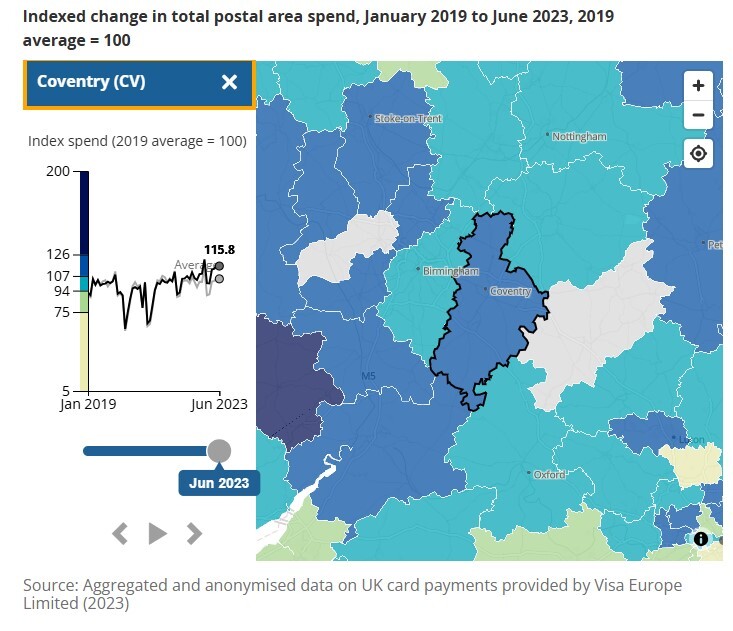
You can explore Coventry's face to face spending from January 2019 to June 2023. The indexed change in total postal area spend has increased from 92.2 in January 2019 to 115.8 in June 2023. This shows that spending in establishments based in the CV postcode increased over this period, to a similar extent to the average across all areas. It was 15.8% higher in June 2023 than the national average in 2019.
The face to face spend in rural areas is relatively higher than in urban areas, compared to 2019.
If you have any Coventry-related research, statistics, or findings that you would like to share here, please get in touch: insight@coventry.gov.uk
See previous e-bulletins for inspiration.
|