|
www.coventry.gov.uk/infoandstats
In this issue:

Source: Insight, Coventry City Council
In previous editions of our newsletter (December 2024), we shared the JSNA Citywide Profile and six local area profiles. This month, we’re spotlighting one of these local area profiles: Binley and Willenhall. See the infographic below for a snapshot of some of the key findings.
The Joint Strategic Needs Assessment (JSNA) gathers evidence about the health and wellbeing of Coventry residents. Its aim is to help leaders across health and care sectors understand and work together to improve the health and wellbeing of the people of Coventry.
The Insight Team has developed localised reports that capture what life is like in different parts of Coventry. These reports celebrate the strengths within each community while also highlighting challenges. They are informed by data, statistics, community feedback, and on-the-ground experiences in these neighbourhoods.
To learn more, read the full report on Binley and Willenhall.
|
 Binley and Willenhall Profile
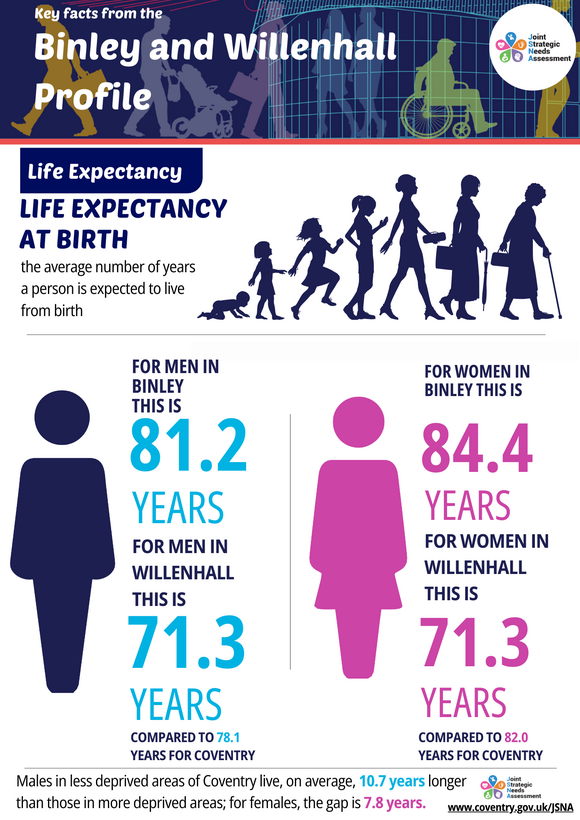
Key facts from the Binley and Willenhall profile
Life expectancy at birth - the average number of years a person is expected to live from birth.
For men in Binley this is 81.2 years. For men in Willenhall is 71.3 years, compared to 78.1 years for Coventry. For women in Binley this is 84.4 years. For women in Willenhall is 71.3 years, compared to 82 years for Coventry.
Males in less deprived areas of Coventry live, on average, 10.7 years longer than those in more deprived areas; for females, the gap is 7.8 years.
Source: Office for National Statistics (ONS)
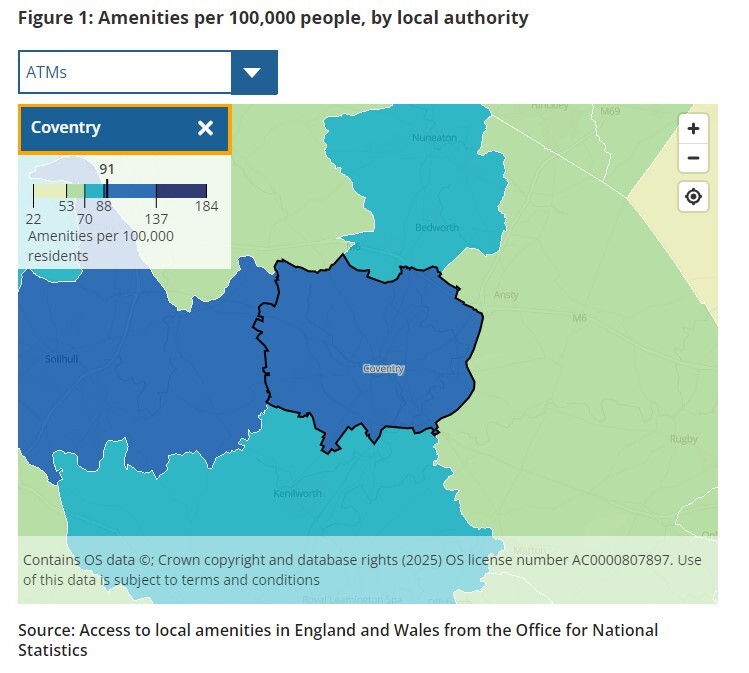
The Office for National Statistics (ONS) has published ‘Access to local amenities’ tool. This interactive tool shows data on 11 different types of local amenities including GP surgeries, dental practices, pharmacies, libraries, community facilities, post offices, cashpoints and parks in England and Wales.
The data highlights the number of amenities per 100,000 residents, which allows comparison of provision in Coventry with other places.
An example of what you can see, in Coventry, 40% of residents are within a 30-minute walk to a railway station. Also, 50% are within a 15-minute walk to a public library.
Source: Centre for Cities
Centre for Cities has published Cities Outlook 2025 report this month. This report provides the latest economic data on the UK's cities and largest towns, allowing us to see how Coventry compares to other places. This report focuses on the difference in wages across the country, what drives this change, and what policy will need to do to raise living standards.
To get the latest data for a wide range of indicators, including population to business start-ups, view the data-tool.
According to this report Coventry's:
- Population has increased by 12% from 2013 to 2023. Coventry ranks 8th highest out of 63.
- The unemployment claimant count rate of Coventry's working age residents was 5.8% in November 2024. Coventry ranks 9th highest out of 63.
- Employment rate was 73.2% in 2024. Coventry ranks 39 out of 62.
- Housing stock has increased by 1.3% in 2023. Coventry ranks 5 out of 63.
- Average weekly workplace earnings was £687 in 2024. Coventry ranks 25 out of 63.
- Housing affordability ratio was 7.2 in 2024. Coventry ranks 36 out of 63.

If you have any Coventry-related research, statistics, or findings that you would like to share here, please get in touch: insight@coventry.gov.uk
See previous e-bulletins for inspiration.
|