|
www.coventry.gov.uk/infoandstats
In this issue:
Source: Insight,Coventry City Council; Public Health England
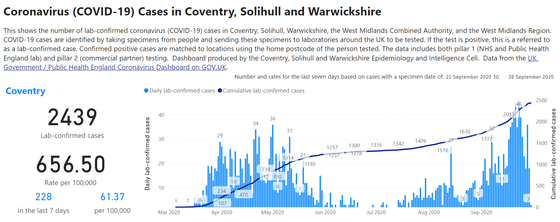
View COVID-19 (Coronavirus) data for Coventry and surrounding areas on the set of dashboards. Local statistics on the number of cases, the number of associated deaths, outbreaks, testing and healthcare are regularly updated here.
There is a lot of information on the local response, including guidance on test and trace.
Source: Insight, Coventry City Council
These indicators were carefully selected to provide a picture of Coventry and its residents.
Figures have been updated for demographics, health, employment and unemployment, qualifications, recorded crime,teenage conceptions, life expectancy, children in low income families, homelessness and number of dwellings.
Read the metadata to learn more about the indicators' context and methodology.
Source:Office of National Statistics
2017-2019 life expectancy data was published last week by ONS
In Coventry, there is a small increase in male life expectancy at birth (78.54 to 78.73) and for female there is a slight decrease (82.35 to 82.15).The gap in life expectancy between males and females for coventry is 3.4 years.
"This is one measure of average life span as an indication of the overall health of a population based on current mortality rates, these are not predictions”
These local area estimates for the latest period were produced using data up to the end of December 2019, and therefore precede the COVID-19 pandemic. Any impact of COVID-19 may have on local area life expectancy would be shown in the next release data covering the period 2018 to 2020.
Source: Insight, Coventry City Council
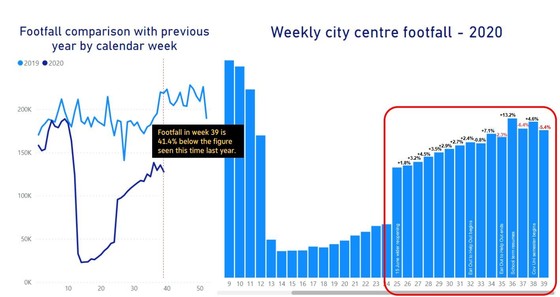
Coventry City Metrics Dashboard is intended to assist with Coventry's Covid-19 reset and recovery. The dashboard contains
- footfall data
- car park occupancy, and
- traffic flows
The graph below is an example which shows the comparison of footfall data in Coventry city centre. It shows that city centre footfall has recovered from its lowest point in early lockdown but remains notably lower than normal levels. Across August and September 2020 footfall was 33% lower than the same period in 2019.
For more interesting information please visit Coventry city metrics dashboard.
|