|
www.coventry.gov.uk/infoandstats
Source: Insight, Coventry City Council
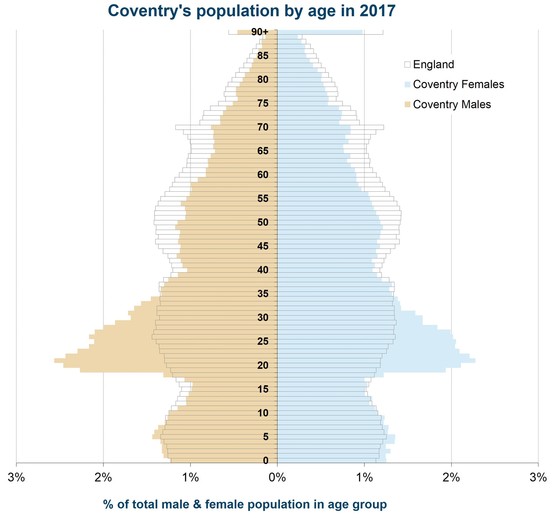
The pyramid below shows Coventry's population distribution by age and gender in comparison to England figures.
Coventry has a notably higher percentage of population aged between 20 and 40. In return, Coventry has proportionately fewer residents aged 40 and above. This helps to illustrate the reasons behind Coventry's significantly lower average age of residents — 32 years — compared to the national average of 40 years.
Source: Insight, Coventry City Council
Two pages of indicators curated to give a picture of Coventry and its residents. Indicators cover population, health, deprivation, the economy, crime, children and young people, and housing. Notable July 2018 updates include:
- In 2017, Coventry was estimated to have a population of 360,100, showing an increase of 6,900 (1.9%) from mid-2016 figures.
- Coventry's employment rate is lower than England's, but the two share a similar unemployment rate.
- Coventry has a notably lower crime rate than West Midlands region and England.
Learn more about the context and methodology behind the indicators here.
Source: Liverpool John Moores University
This report provides prevalence estimates of opiate and/or crack cocaine users (OCU) for all local authorities (LA) in England, and compares them to estimates from previous years. Use the 'Front Sheet' tab to quickly look up data for any LA.
- Coventry is estimated to have had 1,700 to 2,200 OCU in 2014/15, approximating a rate of 8.3 per thousand of the population. The rate is similar across England and the West Midlands region.
- There is an estimated rate of 2.85 OCU for the age group of 15 to 24 years; 9.86 for 25 to 34 years; and 10.39 for 35 to 64 years.
Source: Insight, Coventry City Council
Coventry City Centre had 54 empty prime retail units at the end of the second quarter of 2018. Four of them were newly vacant, while four previously empty units became occupied. With the creation of one new shop unit on Smithford Way, this makes five new shops in total. For further details, please download the report.
Of the five newly occupied units, two are dessert shops. Since the start of 2018, three dessert shops and a cafe have opened in Coventry City Centre.
If you have any Coventry-related research, statistics, or findings that you would like to share here, please get in touch: insight@coventry.gov.uk
See previous e-bulletins for inspiration.
|