|
www.coventry.gov.uk/infoandstats
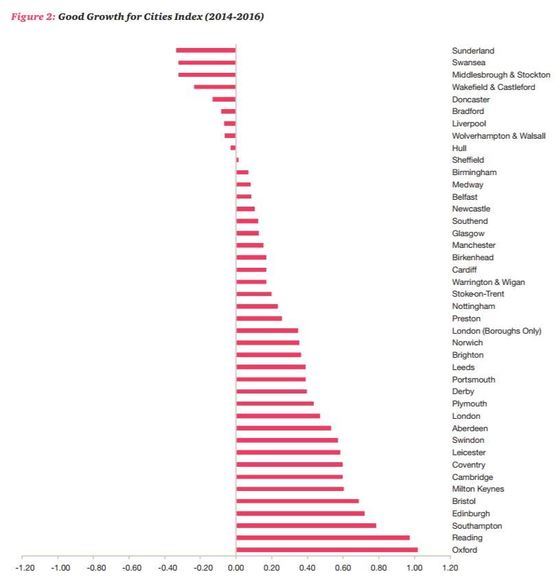
Source: PwC and Demos
In November 2017, PwC and Demos published a report on urban economic well-being in the UK.
The Index stands out from others by evaluating the growth of cities in an inclusive way, looking beyond economic success and taking into account the well-being of the cities' residents.
- Coventry ranks eighth out of the Index's 42 UK cities, closely following Milton Keynes and Cambridge.
- Compared to other cities in the the Index, Coventry's strengths include its unemployment rate, income distribution, and commute time to work.
Source: Fingertips, Public Health England
Public Health England updated the indicators for their framework in November 2017. Their report highlights 38 indicator updates and 5 changes in methodology.
Amongst the updated indicators, here are some key findings for Coventry:
- Fuel poverty in Coventry, which counts the households that can afford sufficient heating, has dropped since the count started in 2011. However, 2015 figures increased slightly from that of 2014, and remains higher than national average.
- For Coventry, both suicide rate and the number of deaths from drug misuse are not significantly different from England's average.
Source: Public Health England
In October 2017, Public Health England published a local authority public health dashboard, which compares Coventry's performance in seven areas to all other local authorities. Read the Public Health Matters blog for some background to the dashboard.
|