 News media contact:
Dylan Rivera
503-577-7534
dylan.rivera@portlandoregon.gov
@pbotinfo
News Blog: PBOT launches Vision Zero dashboard with new data about the city's efforts to eliminate traffic deaths and improve road safety
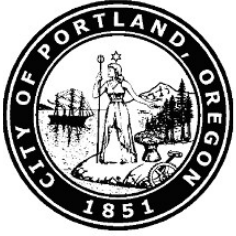
 Screen shot of the dashboard section showing where safety improvements on the High Crash Network are complete (blue), started (orange), or starting soon (green).
(April 8, 2021) Today, the Portland Bureau of Transportation (PBOT) introduced the Vision Zero dashboard, a new tool to help Portlanders better understand and track the bureau's efforts to eliminate deaths and serious injuries from Portland streets.
The new dashboard gives a visually rich snapshot of the variety of quantifiable street improvements, speed limit changes, educational events, and other efforts underway across the city to achieve the goal of zero traffic deaths. It answers some of the most common questions PBOT receives about the city's Vision Zero work. And it will be updated quarterly, so the public can see the latest information throughout the year, without waiting for annual reports.
In a series of maps and charts, the dashboard shows the wide array of activity that goes into reducing the chances of death of serious injury on our streets.
Safety improvements on the High Crash Network
This section of the dashboard looks at traffic safety projects built (or which started construction) from 2014 to the present. Ranging from rapid-flashing beacons to large safety projects that rebuild long corridors, such as SE Foster Road, this section gives you a citywide look at safety projects along our High Crash Network.
High-risk speeding dropped significantly after safety projects went in on corridors like SW Capitol Highway, and along NE Glisan Street and NE 102nd Avenue in East Portland. People driving 10 mph or more above the speed limit declined by 73-87% after safety improvements were installed.
This map is not a comprehensive list of all PBOT safety projects along our High Crash Network. It may not include safety improvements from routine maintenance or paving, nor will it show projects currently being planned or designed.
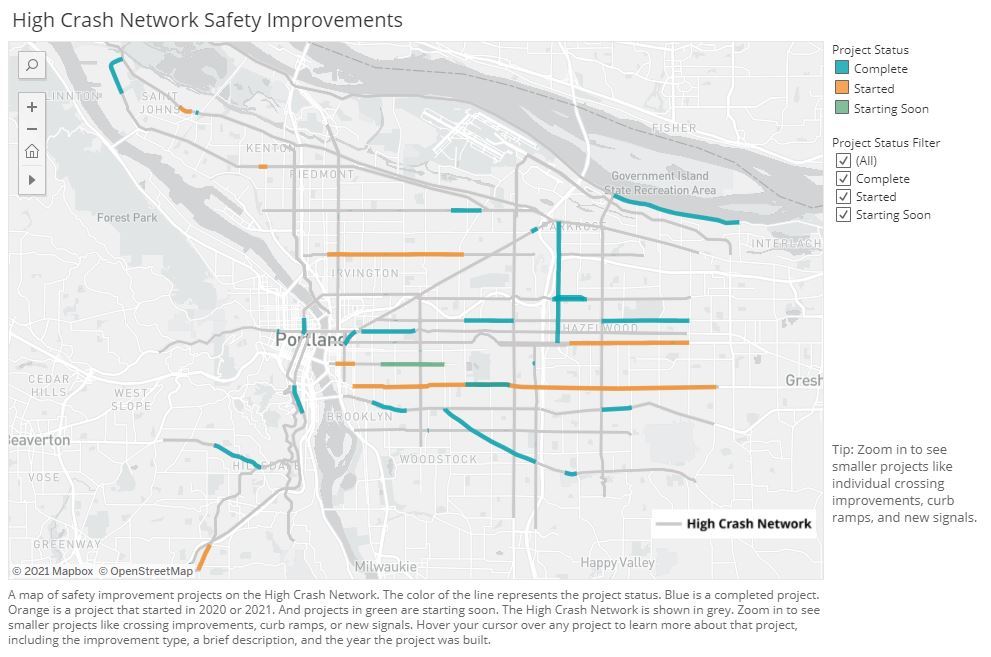
Lowering speed limits
This section of the dashboard shows where speed limits were reduced in 2019 and 2020. PBOT lowers speed limits because it supports our goals in two ways:
-
Safe speeds lower the risk a crash will occur.
-
When crashes occur, safe speeds make it less likely anyone will be killed or seriously injured.
For the most part, PBOT does not have the authority to change speed limits on city streets. PBOT makes requests for speed limit reductions to the Oregon Department of Transportation (ODOT), which controls speed limits statewide. The detail in this section of the dashboard shows speed limits before and after the reduction, and the number of miles of Portland roads where speeds were reduced.
These changes already show signs of cutting speeding. A Portland State University study found Portland's residential speed limit change from 25 to 20 mph reduced the odds of people driving faster than 35 mph by 50%.
 Screen shot of the dashboard section showing streets where speed limits were reduced in 2019 and 2020, with the new speed indicated from a scale of light yellow (20 mph) to darker red (40 mph). A bar graph to the right shows the total miles of road where speeds were reduced each year.
Speed safety cameras
Portland operates cameras for speed enforcement on four corridors. Unlike cameras that police use -- typically in vans that move around the city -- these "fixed" speed-safety cameras are stationary, usually mounted to a pole. This section of the dashboard has a map showing where these camera are and the speed limits along those corridors. It includes a chart showing the total number of vehicles passing by each camera over time. It also shows the number of violations issued per month, per camera.
From the data, it's clear these cameras cut speeding significantly on these four corridors, and has reduced speeding over time. After cameras were in place for two to four years, overall speeding dropped by an average of 71% and top-end speeding decreased by 94%, compared with the period before cameras were installed.
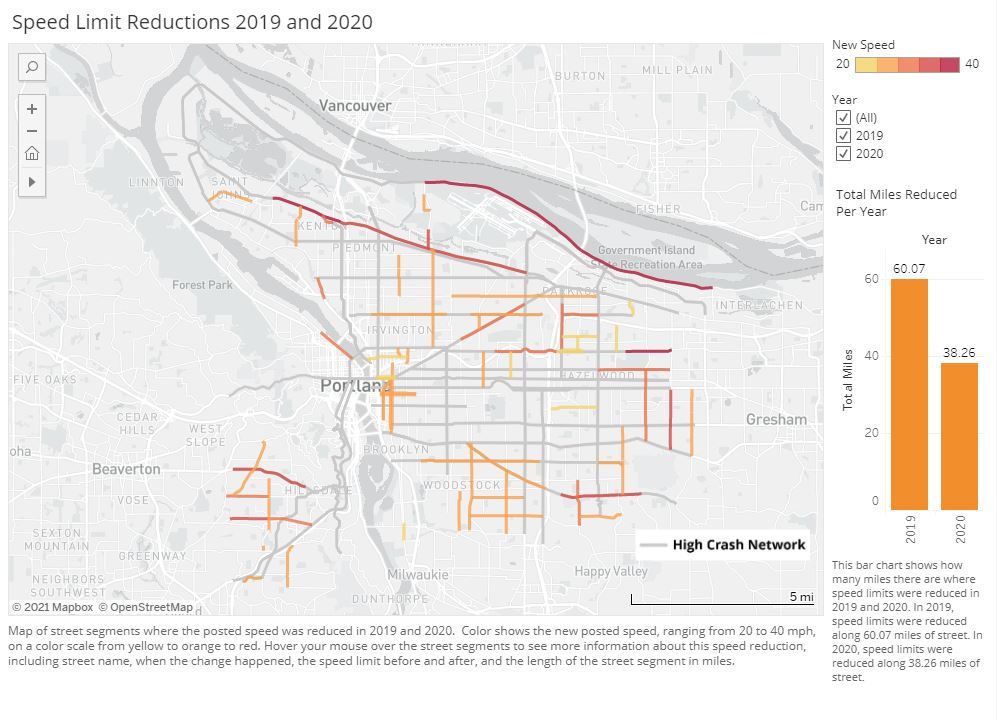
Education and outreach
Each year, Vision Zero staff host and sponsor dozens of transportation safety education and outreach events. The map in this section shows where and how often we’ve held these events, and the range of partners PBOT collaborates with. As the data illustrates, many of these community events were held on or near High Crash Corridors, the city's most dangerous streets and where PBOT concentrates its traffic safety work.
The Vision Zero program has also distributed lawn signs with safety messages such as "It's time to slow down, Portland." This section of the dashboard shows where these yard signs were distributed, by ZIP code.
 Screen shot of the dashboard section showing where Vision Zero outreach events were held 2018-2020. Larger dots indicate more events held at that location. Different colors indicate different types of events.
Crash data from Portland Fire & Rescue
Community members regularly tell PBOT they’d like to see more recent data on crashes. PBOT’s Vision Zero team uses official crash data from ODOT. This source is extremely detailed, but there is typically a lag of two years for data on injury crashes to be vetted, processed, and sent to us.
To provide the community with more timely data, especially during the ongoing Covid-19 pandemic, PBOT collaborated with Portland Fire & Rescue to get more recent data. Fire & Rescue’s emergency responders are often deployed to the scene when a crash happens. While their data is not necessarily as detailed as ODOT’s, Fire & Rescue’s data does provide detailed location information, and whether crashes resulted in injuries. While this data looks different, the information gives PBOT a high-level understanding of what types of crashes have happened in recent months on Portland streets.
Timely data can sometimes reveal patterns and correlations. The dashboard includes a chart showing weekly crashes in 2020 compared to an average of the last several years. It shows how traffic crashes fell dramatically during stay-at-home orders, and rose again as businesses reopened. This reinforces what we know about the link between the amount people drive and the number of crashes.
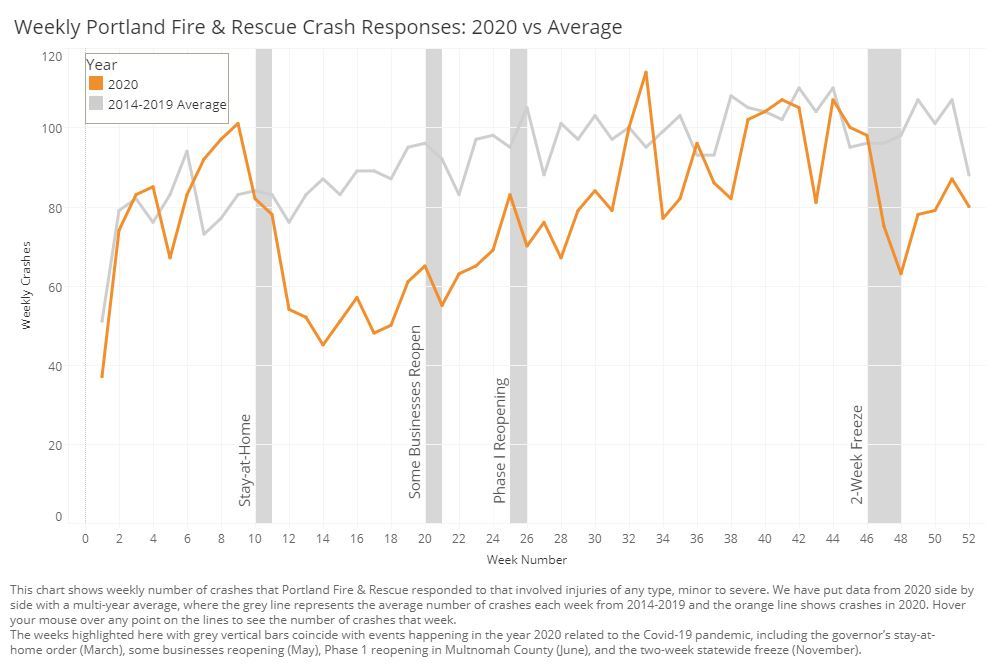 Screen shot of the section showing weekly crash responses by Portland Fire & Rescue. Light grey line shows weekly crashes as an average of years 2014-2019. Dark orange line represents weekly crashes in 2020. Vertical bars indicate various state orders related to the Covid-19 pandemic in 2020.
PBOT Vision Zero staff will update the dashboard quarterly. Depending on the availability of certain data, some sections may be updated less frequently.
As safety projects move to construction or completion, the dashboard will be updated accordingly.
Twice a year, PBOT will publish summaries translated into multiple languages, then work with community-based organizations to distribute them to a broader audience of community members. All summaries will be available on the Vision Zero website.
The Portland Bureau of Transportation (PBOT) is the steward of the city’s transportation system and a community partner in shaping a livable city. We plan, build, manage, and maintain an effective and safe transportation system that provides access and mobility. Learn more at portland.gov/transportation
|