|
December 24, 2022
Dear Neighbors and Friends,
I hope that you and your loved ones are doing well, staying healthy, and looking out for your neighbors and friends during this past week.
It’s Christmas Eve as I’m finishing up this newsletter, the seventh night of Hannukah, and I want to wish you and your loved ones all the best for this holiday season. I hope that you were able to get through the ice and abnormally cold weather safely. Many, many thanks to all the first responders and volunteers who helped our community members go through the last few difficult days. Warmer weather seems to be on the way.
In the first part of tonight’s newsletter, I’ll continue the behind-the-curtain look at this preparatory phase of the 2023 legislative session. I’ll be going into more detail on that in my next constituent coffee, which will be the first Saturday morning of the new year—January 7, 9:00-10:30 a.m. at the Hollywood Senior Center (with a zoom option as well). I’ll have more details in the next newsletter.
On the COVID front, I’m happy to report continuing improvements in nearly all the COVID metrics this week. You’ll see this in the graphs and in nearly all the sections of this newsletter. The most recent OHSU analysis suggests that we reached our peak of COVID infections and hospitalizations earlier in the month. Wastewater analysis for COVID is now in decline.
However, we’re by no means out of the woods for this winter. Hospital personnel remain stressed both by record levels of respiratory infection and an ongoing shortage of workforce. RSV appears to have peaked, along with COVID for now, but flu will remain a problem for quite some time. With booster vaccinations for both COVID and flu remaining relatively low in this country, too many of our seniors (but not just our seniors) continue to face serious illness and death.
Until next week, please do your best to stay happy, healthy and safe. Again, please have a great holiday. And do let me know if you have any questions or thoughts about anything in this week’s newsletter.
The First Round of Bills Submitted for the 2023 Session
In the last newsletter I discussed the deadline we were approaching this past Wednesday to submit our first round of sponsored bills in advance of the 2023 legislative session. I mentioned that it would be intense, with last-minute requests for us to introduce new concepts and for us to join in sponsoring other legislators’ bills.
That turned out to be very much the case. I received my last request to introduce an new bill concept that very morning, and the last requests for sponsorship were still coming in at 4:30 p,m. (with just 30 minutes left). A final offer to sign on to one of mine (funding for summer and after-school programs) even came in at 4:55 pm, too late as it turned out to include that legislator’s name on the initial version of the bill. (We filed that bill close to 4:30).
By the time the deadline arrived, I had filed 30 bills and decided to hold onto another dozen or so that weren’t quite ready. In addition were the bills that went in as Education Committee Bills. (Those are already posted here.)
All of the bills filed by the deadline have already been assigned bill numbers (SB__ for those originating in the Senate, HB__ for those originating in the House) and will be posted on the Legislative website (olis.oregonlegislature.gov) sometime before the day the 2023 Legislature organizes (January 9th). That’s the day new members are sworn in and the new Governor will be giving us her inaugural address. It’s also the day that all the bills that had been filed prior to the deadline will be formally introduced—or “first read.”
Each bill will then be referred by the relevant presiding officer (Senate President or Speaker of the House) to the committee deemed most appropriate. We don’t yet know who will be on each committee or even which committees will exist during the 2023 session. The presiding officers are still meeting with members and trying to figure that out. It’s complicated because they have to juggle overlapping and competing member choices with their own sense of what’s best and the exigencies of the weekly calendar. It’s complicated, a kind of 3-D chess. I know they’re hoping to be able to announce the makeup of all the committees by the end of next week. If they do, I’ll report on it in the next newsletter.
Going back to the bills, remember that these “first-read bills” are just the initial forms of the bills. Many are still quite vague and need to be fleshed out or altered in various ways. Many are just “placeholders,” whose specific content is not yet known. Most will have amendments drafted before or after their first public hearing. In some cases, you’ll find identical bills filed in both chambers, with one serving as a backup. In other cases, there are multiple related versions, each a slightly different attempt to address the same problem. The sponsors will eventually decide which version has “legs” (i.e., has the best chance of moving forward).
It’s a long journey.
ON THE COVID FRONT
Weekly Data Report:
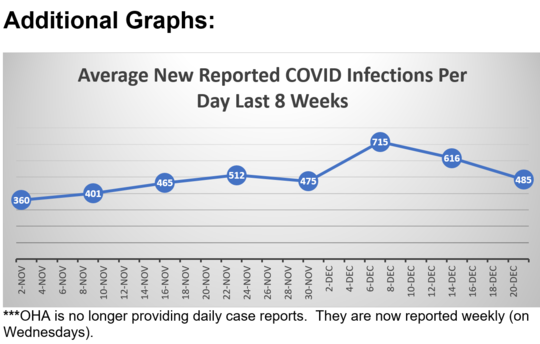
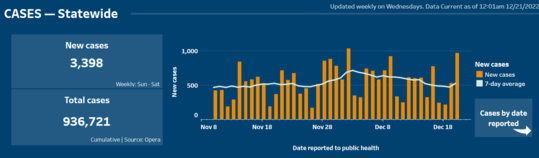
OHA now updates and reports COVID metrics once a week, on Wednesdays. Here are the last set of daily results, for this past week from 12/15/22 through 12/21/22.
As you’ll see, this week’s report is again a mixed one, with reported infections and hospitalizations down and ICU hospitalizations and deaths up.
- The 7-day average for new infections went down again last week, from 616 the previous week to 485 reported infections per day this last week. The number of new cases is again likely an undercount, as many people are using home tests to determine their infection status but are not reporting those results.
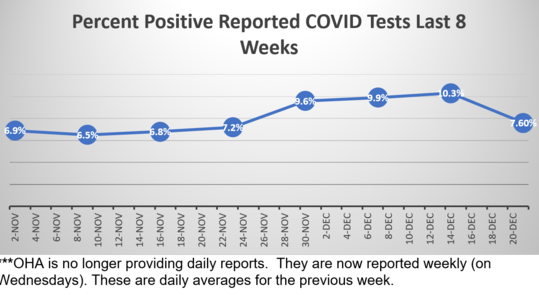
- Average test positivity for the last week has at last gone down last week, to 7.6% vs. the previous week’s 10.3%. Again, this number skews high because it likely reflects a higher proportion of people showing COVID symptoms (and thus reporting or going in for a test, rather than self-testing and never reporting).
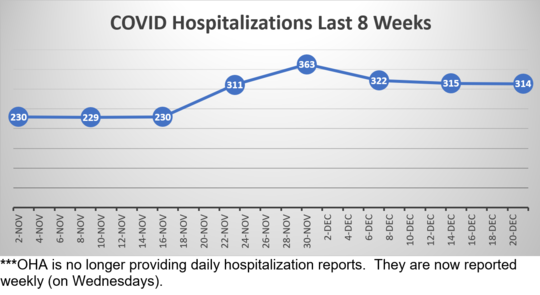
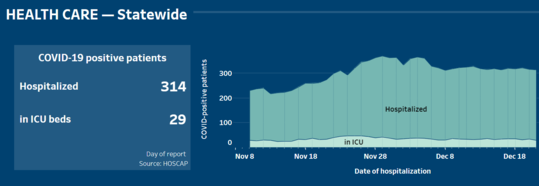
- On Wednesday there were 314 COVID-19-related hospitalizations statewide, a very slight decline from 315 last Wednesday. Hospitalizations are now our best indicator of disease spread. Again, however, most of these hospitalizations are not in and of themselves due to COVID—more than half are those who tested positive after having been admitted for other reasons.
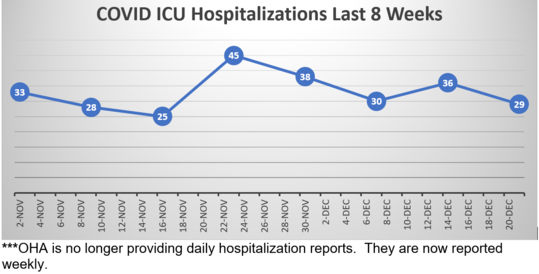
- The number of COVID patients in Oregon’s ICUs on Wednesday went back down again, from 36 to 29. These are the most serious COVID infections.
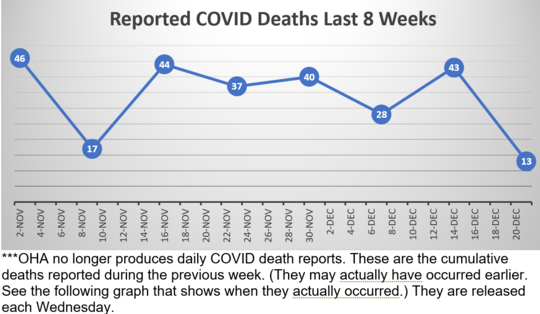
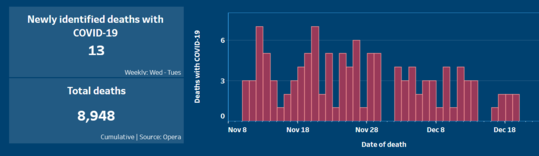
- There were just 13 COVID-19-related deaths reported during the last week, down from the previous week’s 43. Again, some of every week’s reported deaths actually occurred in earlier weeks but were just reported to the state, and others that likely occurred have yet to be reported. The newsletter’s final graph shows when the deaths actually occurred, and you’ll see that the number of COVID deaths each day continues to remain low.
Weekly County Report: More Counties Move to Medium Risk
The CDC assigns risk levels based on a combination of the number of new COVID cases and the number of people in hospital for COVID.
According to the CDC Daily Counter (updated each Thursday), all Oregon counties are at either Low or Medium Risk, as has been the case for nine out of the last eleven weeks. However, more counties have moved from Low Risk to Medium Risk.
Sixteen Oregon counties (up from 10 last week) have reported infection rates that place them in the Medium Risk category: Baker, Coos, Clackamas, Clatsop, Columbia, Curry, Douglas, Gilliam, Jackson, Josephine, Lane, Malheur, Multnomah, Union, Wallowa, and Washington.
The remaining 20 Oregon counties (down from 28 last week) are at Low Risk.
We can also track the cases, deaths, and test positivity rates for each county at this website.
I’m pleased to report that all three Portland-area counties went down last week. Clackamas County is the region’s highest, but it dropped to 10.6%, down from last week’s 11.8%. Multnomah County again saw a decrease, down to (a still high) 6.8% from last week’s 9.2%. Washington County is now at 8.0%.
Remember that these are all based on reported test results, and so are more likely to be a little higher than the total percent positivity (i.e., if one were to include all tests taken).
This Week’s Wastewater Monitoring Report: A Return to Decreases
With testing reports giving us just a fraction of infections out there, wastewater monitoring has become a more reliable indicator of the amount of virus in cities around the state. That report is updated each week.
This week’s report sees more cities showing decreases. As you’ll see, 21% of the cities observed showed decreases or sustained decreases last week (an improvement over the previous week’s 3%). Six percent showed an increase or a sustained increase (vs. 3% the previous week). Seventy-three percent showed no change (down from 94%).
Tillamook again was the only city to show sustained increases last week.
OHSU Report Begins to Show Declines
Another OHSU forecast report https://www.ohsu.edu/sites/default/files/2022-12/OHSU-COVID-Flu-RSV-Forecast-Dec-16-2022.pdfwas released on December 16. It is now being called the “OHSU Oregon Hospital Forecast and Trends: COVID, Flu, RSV.”
It uses data provided by OHA and others that project how fast the viruses may spread in the population and provides projections on possible outcomes, including infection rates and impacts on hospital capacity. The lead author is Dr. Peter Graven, Director of OHSU’s Office of Advanced Analytics.
This week’s report reflects a reduction in most metrics last week, which you can see elsewhere in this newsletter. The last forecast predicted increases through the first week of December, followed by gradual declines. That appears to be where we are right now.
Here are some details:
- COVID-19, flu and RSV cases are expected to drop in the next two months. But the surge after Thanksgiving suggests holiday gatherings could increase the spread of illnesses more than predicted.
- After a clear Thanksgiving related increase in hospitalizations across the nation, the increase across all regions has slowed.
- As of Dec. 14, 315 people were in the hospital with COVID-19 in Oregon, down from a peak of 370 on Nov. 29.
- The rate of Emergency Department visits for COVID appears to have peaked at 5.3% on 11/20. The rate has now declined to 4.0%.
- The number of people in the hospital with flu was near record levels during the week ending Dec. 3.
- The number of people in the hospital with RSV reached record levels during the week ending Dec. 3. But the number is dropping.
- COVID, flu and RSV are all expected to stay high through December and then decline over the next two months.
- Oregon seems to have seen peaks in:
- Emergency room visits for COVID-19, on Nov. 20
- Positive COVID tests, on Dec. 4
- Levels of COVID in wastewater, on Dec. 7
- Oregon is seeing its lowest number of empty hospital beds (254) since last January.
- More than 300 people are waiting in emergency rooms for beds (“boarding”).
- As of Dec. 16, eight children were in the hospital with COVID.
- Although the current surge appears to be declining, we must expect the number of deaths to increase (since deaths are a lagging indicator, following infections and hospitalizations).
COVID Q & A from OHA (from OHA weekly newsletter)
Dr. Paul Cieslak, OHA senior health advisor and medical director, Communicable Diseases and Immunizations answered this week’s questions.
Q: Does the immune system work like a muscle where frequent exposure to germs allows it to "work out" and ultimately get stronger? If so, does this mean we should provide opportunities for our immune system to get exercise by going to a grocery store unmasked, or having a playdate with a kid who's "a little bit" sick? – Anna, Bend
A: “The answer is ‘sort of.’ Overcoming an infection will generally give you some immunity against infection against that same germ. However, unlike the case with exercise, you must suffer through and survive the sickness to enjoy the benefit of stronger immunity. Moreover, because viruses evolve – sometimes rapidly – that immunity may not mean much, because it may be limited to a given strain of virus or other germ. You may not see that virus or germ ever again, and you will still be susceptible to others.
“For instance, the flu virus evolves every year. That’s why a flu shot is recommended every year. If you get the flu one year, you won’t necessarily be immune to the next year’s flu. And the common cold is caused by many different viruses. Getting a cold once does not mean you’ll be immune to future viruses that cause the common cold. We also know that COVID-19 reinfections are common because the COVID-19 virus mutates and evolves.”
Q: Those of us who received the bivalent booster in September are approaching the end of the period when the vaccine is most effective. After that period ends, will I be more susceptible to severe disease, or just to being infected? Will we be able to get another bivalent booster, or is there another vaccine in the works for when this effectiveness declines significantly? – John, Portland
A: “You will most likely become more susceptible, at least to being infected. The good news is that protection against severe disease lasts longer because you get it from immune memory cells, which last longer than antibodies. At this point it’s too early to tell when the immunity you get from a bivalent booster wears off, and the CDC has not yet recommended a second bivalent booster. It’s also possible that as the virus evolves, future boosters will have different strains — as is the case with influenza vaccine. Stay tuned.”
From OHA: COVID-19 Data and Reporting Shifting Next Month
Several OHA COVID-19 data dashboards and reports are changing next month as the pandemic response continues to move into existing public health systems.
Beginning in January, updates to the following reports will occur quarterly in the second week of the month, instead of monthly:
Oregon COVID-19 Case Demographics and Disease Severity
Oregon COVID-19 Cases by ZIP Code
COVID-19 Data Report
For a list of data dashboards and reports that will either be archived and no longer updated, as well as those that will continue on their current schedule, click here.
The changes will allow OHA to align its data with other respiratory pathogen reporting and focus on what is most relevant to the public.
“This shift represents an important step toward informative, sustainable surveillance for a pathogen that is now endemic,” said Melissa Sutton, M.D., M.P.H., medical director for respiratory viral pathogens at OHA’s Public Health Division.
Additional COVID Updates and Links
- Here’s the latest on COVID in Oregon from the Oregonian.
- Here’s status update on the “Tripledemic” from the New York Times. They predict that fever-filled weeks lie ahead."l [This article may only be available to subscribers of the New York Times.]
- An appeals court has ruled that the federal government cannot require contractors to be vaccinated./
-
A study reported by the Kaiser Family Foundation shows that only 7 in 10 parents now believe that all children should be vaccinated against the common infectious diseases Mumps/Measles/Rubella before entering school. This is down from 82% pre-pandemic. Almost three in ten (28%) now say that parents should be able to decide not to vaccinate their school-age children, even if this creates health risks for others, up from 16% in 2019.
- Another negative consequence of the pandemic: gun-violence deaths among children surged during the pandemic, according to a study reported by the JAMA Network.
- Here’s a story about the t true legacy of Dr. Tony Fauci now that he’s about to retire.
- The Atlantic has an article about the potential prevalence of COVID in animals.
- Here’s an interesting opinion piece about what the never-ending masking debate is really about.-
- Speaking of which, the New York City mayor is encouraging people to mask up again. [This article may only be available to subscribers of the New York Times.]
- The former CEO of EcoNorthwest has an opinion piece thanking outgoing Governor Kate Brown on her leadership, which saved many days, during the height of the pandemic. .I agree with him.
- A study reported by Cambridge University Press argues against the need for routine COVID testing among patients in healthcare facilities.
- Here’s another look at the low rate of seniors receiving COVID boosters, despite waning immunity. [This article may only be available to subscribers of the New York Times.]
- An international study of COVID attitudes shows the prevalence of negative attitudes towards those who have chosen not to be vaccinated against COVID.
- As another indicator of the impact of the COVID pandemic, the CDC reports a reduction in life expectancy in the U.S., from 80 years in 2020 to 76.4 years in 2021. Here are the details regarding the increase in death rates.
-
Nasal vaccines are becoming more common around the world, but their effectiveness isn’t yet clear.
- On Jan. 26, the FDA’s vaccines committee will meet to discuss the future of Covid-19 booster shots and variant strain selection moving forward. The Director of the FDA’s Center for Biologics Evaluation and Research (CBER), and CBER previews some of what will be discussed in that meeting about the future of the COVID vaccines as approaches to the disease evolve.
- Here’s a (pretty technical) report from Science with the latest thinking on how COVID disrupts one's sense of smell.
- The New York Times reports on steps that hosts are taking to reassure the guests at their parties.[This article may only be available to subscribers of the New York Times.]
- Can you get COVID and flu at the same time? Or any other combination of respiratory ailments? Technically yes, but it's going to be rare. Here's more. Here's more. [This article may only be available to subscribers of the New York Times.]
Here again are some COVID resources that you will find useful:
If the above links are not providing you with answers to your questions or directing you to the help that you need, please consider me and my office to be a resource. We’ll do our best to assist you or steer you in the right direction.
Want to See Past Newsletters?
If there was COVID-related information in a past newsletter that you want to go back to, but find you’ve deleted it, you can always go to my legislative website (senatordembrow.com), click on “News and Information,” and you’ll find them all there. Also, if someone forwarded you this newsletter and you’d like to get it directly, you can sign up for it there.
Best,
 Senator Michael Dembrow
District 23
email: Sen.MichaelDembrow@oregonlegislature.gov
web: www.senatordembrow.com
mail: 900 Court St NE, S-407, Salem, OR, 97301
|