|
September 19, 2022
Dear Neighbors and Friends,
I hope that you and your loved ones are doing well, staying healthy, and looking out for your neighbors and friends during this past week.
This is a crazy time for legislators, with the imminent deadline for requesting bill drafts for the 2023 session (more on that below). And if you haven’t noticed, we’re also well into the 2022 election cycle, which means campaigning, fundraising, and on and on.
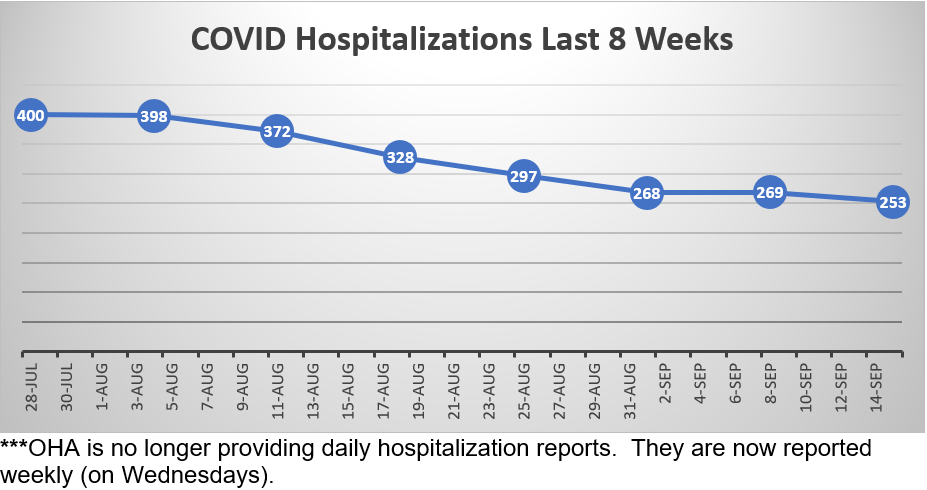
On the COVID front, this is the last newsletter where I’ll be able to give you daily numbers for reported infections, percent positive, and COVID deaths. As of last Thursday, OHA will be reporting numbers once a week (each Wednesday) rather than each day. . But I’ll continue to be able to show you the week-over-week trends, which will remain very useful.
Overall, we continue to see declining numbers, but not the steep declines of a few weeks ago. OHSU’s biweekly forecast came out on Friday, and you’ll see confirmation of that assessment, along with a forecast that envisions continued slow declines for the next month and a half, followed by gradual increases.
You’ll find more details in the summaries, graphs, and links in tonight’s newsletter.
Until next time, please do your best to stay healthy and safe. And let me know if you have any questions or thoughts about anything in this week’s newsletter.
Approaching the Bill Draft Deadline
As I've explained before, the Legislative cycle functions on a series of deadlines, and we are about to hit another one. These deadlines keep the legislative work on track, but it also creates a lot of stress.
This Friday, September 23, is another one of those: the deadline for submitting "pre-session" bill concepts for the 2023 session. Bill requests that make that deadline must be drafted by early December and then become available for filing in time to be released on the first day of session in early February. We can still file bills after that time, but in a much more limited fashion. And they can't be filed until after the session has actually begun.
So, not surprisingly, my office (and that of my colleagues) is being barraged by requests from a variety of organizations and advocates for bill concepts. Some involve funding requests, while others are changes in state policy. Some are redrafts of bills that didn't quite make it last session. Others are fully-developed recommendations from interim work groups. Others are "place-holders"--concepts that are still very broad in nature, which will continue to be worked on through the fall and then refined during the session via amendments.
In addition to bills coming out of legislators' offices, concepts are also being requested from legislative committees. As Chair of the Senate Education Committee, I've been submitting most of my education-related concepts through the committee. They include place-holders related to the work we've been doing on summer learning, educator workforce, and higher education affordability. Work on all these issues will continue and the bills will be fleshed out over the coming months.
More details to come as the session approaches.
Improvements on the Wildfire Front
Wildfires continue to burn around the state, but incipient fall conditions appear to be taking us in the right direction.
The Office of Emergency Management wildfire dashboard gives us some good news: the number of fires remains at 21, with a little over 332,705 acres (up from 286,255). Happily, no Oregonians are currently under Level 3 (Go Now) evacuation orders (down from 1,461), none (down from 6,438) under Level 2 (Be Ready), and 6,657 (up from 3,076) under Level 1 (Be Prepared).
The biggest fire in the state remains the Double Creek Fire near the community of Imnaha in the Hells Canyon National Recreation Area in Wallowa County in the far northeast corner of the state. However, its growth has slowed dramatically, from 150,000 last week to 157,264 today. It is now 27% contained.
The biggest growth has been in the Cedar Creek fire near Oak Ridge in Lane County. It is now at 113,322 acres, up from nearly 85,000 acres last week, and is now 11% contained (up from 0%). As part of the firefighting effort, controlled fires were ignited on the perimeter in order to contain the conflagration.
It continues to create smoky conditions in Eugene and other parts of the Valley.
For a city-by-city picture of air quality in Oregon, I’d recommend DEQ’s Air Quality Map and Oregon Smoke..
For daily information on the fires around the region, here’s the Northwest InterAgency Coordination blog: http://nwccinfo.blogspot.com/
And again, I’d also recommend KOIN TV’s Wildfire Watch 2022 for ongoing information and stories. They’re doing a great job of covering the wildfire situation in the state.
ON THE COVID FRONT
Weekly Data Report:
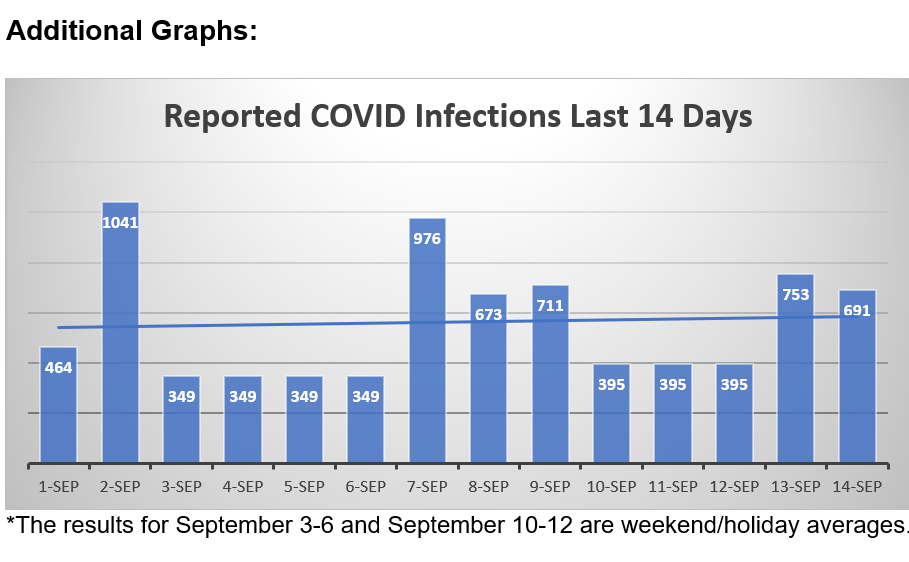
Here is what this last week looks like in Oregon, based on information gleaned from OHA's daily reports. At the end of the newsletter you’ll find graphs that I’ve put together showing the daily counts and trends for the last two weeks.
As I mentioned in my last newsletter, starting this past Thursday, OHA will no longer be providing this information on a daily basis. Instead, the data will be provided only on a weekly basis, on Wednesdays (as they already have for hospitalizations).
Here are the last set of daily results, for this past week from 9/9/22 through 9/14/22.
We see that the last week has shown declines in all the chief COVID metrics--infections, test positivity, hospitalizations, and deaths—but overall COVID in Oregon appears to have stabilized for now.
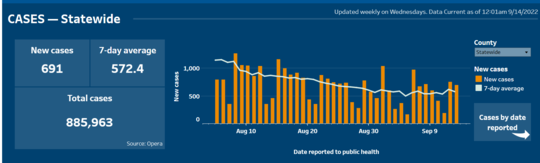
- The number of reported infections has declined only slightly over the last week. OHA reported 4,013 new cases of COVID-19 during the week of September 9-14 (vs. 4,086 the week before), a 7-day average of 573 per day (vs 584 the previous week). The number of new cases is again likely an undercount, as many people are using home tests to determine their infection status but are not reporting those results.
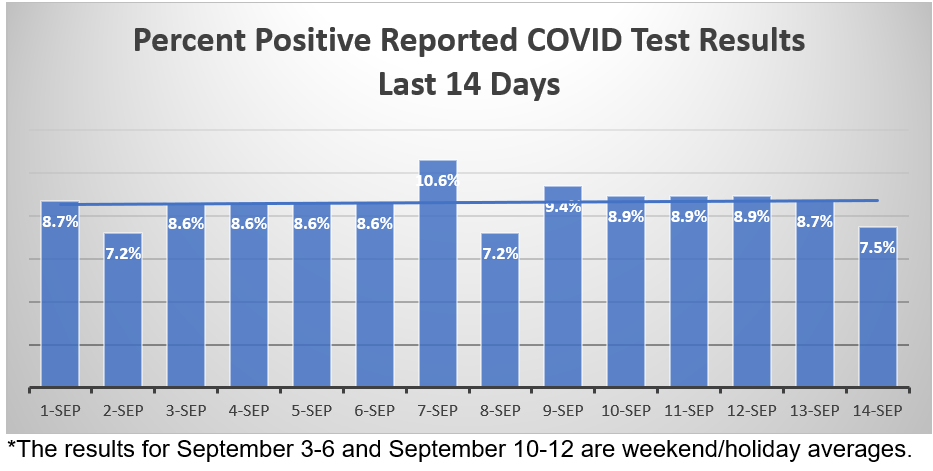
- Average test positivity for the last week was 7.5%, vs. 8.5% the previous week. Again, this number skews high because it likely reflects a higher proportion of people showing COVID symptoms (and thus going in for a test, rather than self-testing).
- On Wednesday there were 253 COVID-19-related hospitalizations statewide, vs. 269 last Wednesday. Hospitalizations are now our best indicator of disease spread. Again, however, most of these hospitalizations are not in and of themselves due to COVID—more than half are those who tested positive after having been admitted for other reasons.
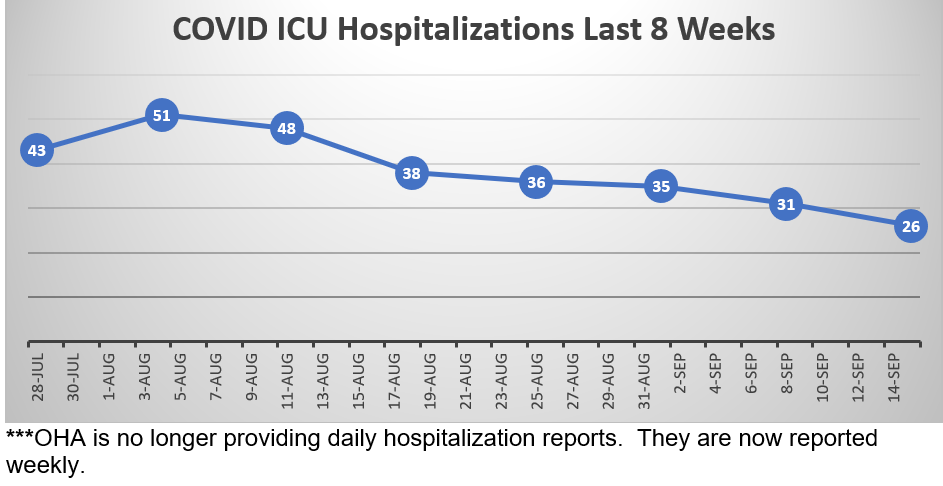
- The number of COVID patients in Oregon’s ICUs has gone down again over the last week: 26 on Wednesday, down from last week’s 31. These are the most serious COVID infections.
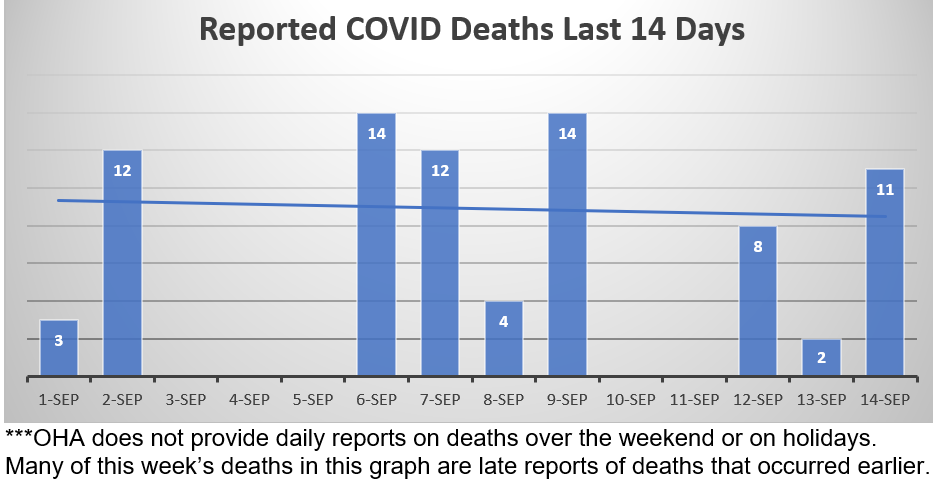
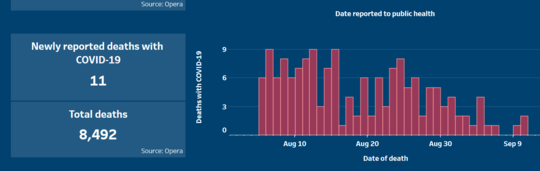
- There were 39 COVID-19-related deaths reported during the last week, down a little from last week’s 42. Again, some of these deaths actually occurred in earlier weeks but were just reported to the state.
Weekly County Report: 29 Out of 36 Counties Again at Low Risk
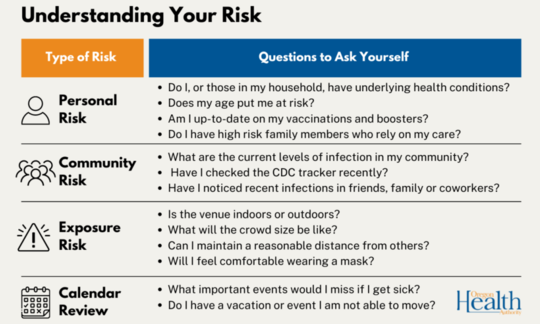
The CDC assigns risk levels based on a combination of the number of new COVID cases and the number of people in hospital for COVID.
According to the CDC Daily Counter (updated each Thursday), 29 Oregon counties (same as last week)— Benton, Clackamas, Clatsop, Columbia, Coos, Crook, Curry, Deschutes, Douglas, Gilliam, Grant, Harney, Jackson, Jefferson, Josephine, Klamath, Lake, Lane, Lincoln, Linn, Marion, Morrow, Multnomah, Polk, Tillamook, Umatilla, Washington, Wheeler, and Yamhill—are at Low Risk.
Four Oregon counties (down from 3 last week) have reported infection rates that place them in the Medium Risk category: Hood River, Malheur, Sherman, and Wasco.
Three of the four Eastern Oregon border counties (down from 4 last week) are now at high risk of COVID transmission: Baker, Union, and Wallowa.
Here’s what the CDC recommends for this category: Stay up to date with COVID-19 vaccines. Get tested if you have symptoms. Wear a mask if you have symptoms, a positive test, or exposure to someone with COVID-19. Wear a mask on public transportation. You may choose to wear a mask at any time as an additional precaution to protect yourself and others. If you are at high risk for severe illness, consider wearing a mask indoors in public and taking additional precautions.
We can also track the cases, deaths, and test positivity rates for each county at this website. at this website..
All three Portland-area counties showed decreases in positivity rates from the previous week. At 6.8%, Multnomah County shows a big decrease from last week’s 9.2% and is now the lowest of three Metro counties. Clackamas County is 8.2%, down from last week’s 8.9%. Washington County is no longer the lowest of the three Metro counties at 7.0%, but it too shows a decrease from last week’s 8.6%.

This Week’s Wastewater Monitoring Report Again Shows Little Change in Oregon Cities
With testing reports giving us just a fraction of infections out there, wastewater monitoring has become a more reliable indicator of the amount of virus in cities around the state. That report is updated each week.
This week’s report shows us that two cities show increases, two cities show decreaseses, and five cities show sustained decreases. The great majority of cities again show little change in the amount of virus in their wastewater.
Of the cities monitored, 5% showed decreases (same as last week), 13% showed sustained decreases (vs. 15% last week), 5% showed increases (same as last week), 0% showed sustained increases (same as last week), and 72%% remained on a no-change plateau (vs. 79% last week).
OHSU Forecast: Downward COVID Slope Continues
The current OHSU Forecast Report, published on Friday, uses data provided by OHA and others that project how fast the virus may spread in the population and provides projections on possible outcomes, including infection rates and impacts on hospital capacity. The lead author is Dr. Peter Graven, Director of OHSU’s Office of Advanced Analytics.
It now appears every two weeks.
This week’s report confirms that the recent surge has peaked and is continuing to recede. The forecast is largely unchanged from the last report.
- Oregon now has the 15th lowest level of case rates in the nation.
- Wastewater data continue to show declining viral levels, though not as low as after the BA variant wave.
- The number of people in Oregon hospitals as of Sept. 14 is 253. The decline in the number of patients with COVID has slowed but continues.
- Most of these hospitalizations were not primarily for COVID, but were “incidental” cases, i.e., patients who tested positive upon admission but were there for another reason. The incidental share is expected to increase mildly from 60 to 64% during the forecast period.
- Many patients who were admitted to hospitals for reasons other than COVID have underlying conditions, and COVID may have tipped the scales toward admission. Future reports will modify the use of “incidental,” with new estimates to better account for the number of additional beds needed for COVID.
- Some of the slowing in hospital patient declines is due to “boarding”—patients who cannot leave because there is not a care alternative presently available for them. Boarding showed a spike in the last 2 weeks, reaching 247 patients statewide.
- Visits to the emergency department for COVID-like illness are at 2.6% of all emergency visits, a slight decrease.
- As of Sept 13, COVID patients occupy 4% of Oregon's intensive-care beds.
- The number of hospitalized children is at 4 as of Sept. 15.
- Test positivity has shown a continued decline, down to 8%, though it is still above the 5% standard for low prevalence (with good testing patterns).
- COVID vaccinations have increased slightly as the updated Pfizer and Moderna bivalent boosters have become available.
- The updated bivalent boosters do not have a specific effect in the forecast yet. Their effectiveness is similar to previous boosters and the number of doses given is expected to be similar to the estimates in previous versions of the forecast. Thus the results have generally accounted for the updated boosters.
- The forecast continues to predict the current declines bottoming out during the first week of November, then rising again, so that by the end of the year we’ll be back to where we are right now.
- A flu forecast shows a likely vigorous return of influenza. By December, flu is expected to outpace COVID.
- The forecast is showing a slightly slower decline than the previous forecast and a later start to the fall surge.
- The number of deaths per day is expected to remain low for the next few months.
Additional COVID Updates and Links
Here again are some COVID resources that you will find useful:
If the above links are not providing you with answers to your questions or directing you to the help that you need, please consider me and my office to be a resource. We’ll do our best to assist you or steer you in the right direction.
Want to See Past Newsletters?
If there was COVID-related information in a past newsletter that you want to go back to, but find you’ve deleted it, you can always go to my legislative website (senatordembrow.com), click on “News and Information,” and you’ll find them all there. Also, if someone forwarded you this newsletter and you’d like to get it directly, you can sign up for it there.
Best,
 Senator Michael Dembrow
District 23
email: Sen.MichaelDembrow@oregonlegislature.gov
web: www.senatordembrow.com
phone: 503-281-0608
mail: 900 Court St NE, S-407, Salem, OR, 97301
|