|
September 5, 2022
Dear Neighbors and Friends,
I hope that you and your loved ones are doing well, staying healthy, and looking out for your neighbors and friends during this past week.
Today of course is Labor Day, a day set aside to recognize the important, essential work performed by Oregonians every day and in so many ways. I hope you’ve been able to spend a very pleasant day, and also spend a little time thinking about what it represents. It’s a day to celebrate improvements in working conditions that have been made thanks to the incalculable sacrifices and stubborn persistence of many who came before us. It’s also a day to recognize the many struggles and inequities that continue to plague working people in our state. It’s a day to commit and recommit to the hard work of social justice and worker solidarity and mutual support.
It also or course marks the beginning of the final two months before the next election, when the campaigns, the door-knocking, the mailers, the calls and the texts really start to ramp up. This will be a particularly consequential election for us here in Oregon, both in terms of candidates and ballot measures. If you’re a reader of this newsletter, I know you’ll do your research, remember to vote when the time comes, and help as you can.
In tonight’s newsletter you’ll find the latest on wildfires in Oregon (we’re currently experiencing by far the worst fires of the season) and details about our latest economic and revenue forecast from the Oregon Office of Economic Analysis.
On the COVID front, you’ll find the latest numbers and the latest forecast from OHSU. As you’ll see, hospitalizations and deaths continue their decline, as we continue to come down from the latest Omicron surge that began late in the spring. OHSU is still cautioning us, though, that the downturn may start to reverse as we move further into fall.
One big potential game-changer is the new COVID boosters that were finally approved by the FDA, CDC, and the Western States Scientific Safety Review Workgroup. It’s the first “bivalent” booster available, focused both on the original COVID virus and its current Omicron variants. You’ll find links to several articles explaining how it works and how soon you can and should get one.
Finally, let me take a moment to apologize to any of you who signed up for Saturday’s Zoom constituent coffee and were unable to get in. You didn’t miss anything. Technical problems prevented us from being able to do it this month or to let you know what was going on. I’m very sorry about that.
On the positive side, those who are able will have the opportunity to join NEXT Saturday’s Bike Town Hall, always a very special day. You’ll find details about that below. Hope to see you there.
Until next time, please do your best to stay healthy and safe. And let me know if you have any questions or thoughts about anything in this week’s newsletter.
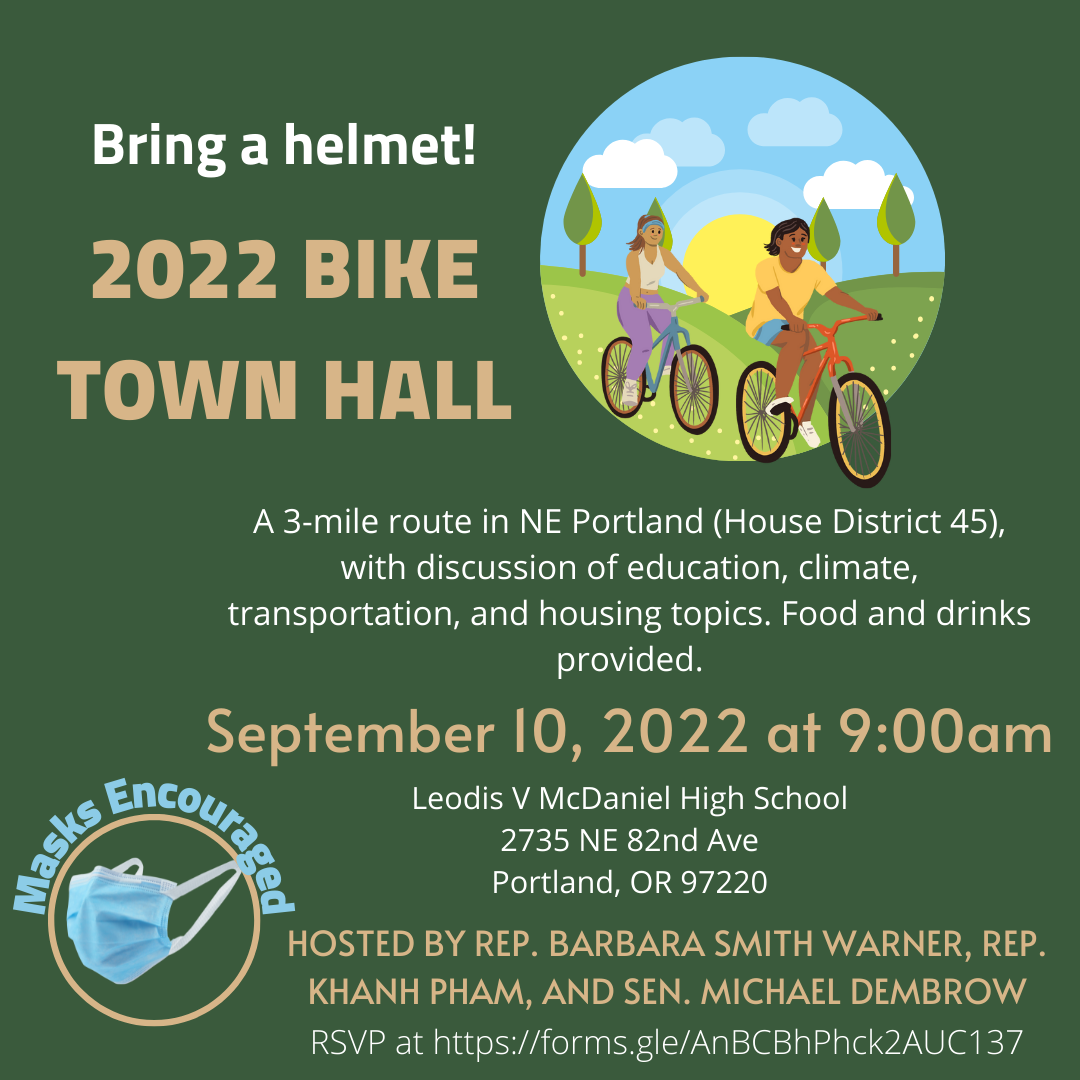
Coming on Saturday: 2022 Bike Town Hall!!!
Yes, it’s that time of year again: when we take our town hall outside, in very good company: Representatives Barbara Smith Warner (HD 45) and Khanh Pham (SD (46), AND YOU!!!
This year’s town hall will be on September 10. We’ll be focusing on the northern (HD 45) part of the district (we alternate every year).
This year's Annual Joint Bike Town Hall will feature a casual, non-strenuous 3 mile group bike ride, using approved bike routes and protected bike lanes through NE Portland. We’ll be stopping along the way to meet with locals working on interesting projects. Discussions along the route will highlight education, climate, transportation, and housing.
Let us know if you need to borrow a bike! Food and drinks provided. Bring a mask in case we go indoors or get in close company for
Saturday, Sept 10th, 9:00 am - 12:30pm Starting Location: Leodis V. McDaniel High School (former Madison HS), 2735 NE 82nd Ave. Portland, OR Exact route information will be provided after registration. Please contact maria.gomez@oregonlegislature.gov with any questions.
Another Difficult Labor Day Weekend for Wildfire
Although the fires we’re currently experiencing are nothing like the horrible catastrophes of Labor Day 2020, with widespread destruction and deaths (as a result of unusually powerful winds from the east), we are currently experiencing serious damage and dangerous smoke levels in various parts of Oregon, Washington, and California.
The Rum Creek Fire, near Merlin in Josephine County, which a week ago was at 8000 acres, is now more than 18,000 acres and continuing to blanket the entire Rogue Valley in unhealthy levels of smoke. (I unfortunately experienced that first-hand this week.)
Another lightning-provoked fire, the Cedar Creek Fire near Waldo Lake in eastern Lane County, also started this week and has already burned around 16,000 acres. It is pouring smoke into much of central Oregon. You can read more about the Cedar Creek fire here.
The third big fire in Oregon right now is the Double Creek Fire near the community of Imnaha in the Hells Canyon National Recreation Area in Wallowa County in the far northeast corner of the state. Its explosive growth makes it by far the state's largest at 43,668; as of this morning it was 0% contained. You can read more about the Double Creek Fire here.
The Department of Forestry’s Wildfire Blog has more information about the Rum Creek fire.
According to the Office of Emergency Management’s wildfire dashboard, there are 37 fires currently burning around the state, with a little over 80,000 acres involved. 213 people are under Level 3 (Go Now) evacuation orders, 1,241 under Level 2 (Be Ready), and 11,811 under Level 1 (Be Prepared).
To see the smoke risk and air quality around the state, go to Oregon Smoke. https://www.oregonsmoke.org
For daily information on the fires around the region, here’s the Northwest InterAgency Coordination Blog.
And again, I’d also recommend KOIN TV’s Wildfire Watch 2022.for ongoing information and stories. They’re doing a great job of covering the wildfire situation in the state.
The Latest Revenue Forecast: Excellent News for Now, But Uncertainty Ahead
This past week we got to hear the latest economic analysis and revenue forecast from Oregon’s Office of Economic Analysis (OEA). The Legislature receives this report on a quarterly basis in a joint meeting of the Senate and House Finance/Revenue Committees.
The latest analysis is quite similar to what we’ve been used to since September 2020 (when the effects of the pandemic and the first federal stimulus payments were first felt): unexpectedly high corporate and individual revenues have been coming in, leading to another hike in the total projected for the 2021-23 biennium (which ends next June 30). As a result, they’re also projecting an increase in the kicker dollars that will be sent out to taxpayers and to K-12 education. At the same time, we’re continuing to see record or near-record low unemployment in the state.
Despite all this good news, however, a pall of uncertainty hung over the forecast. And it all had to do with inflation.
Mark McMullen and Josh Lehner of OEA pointed out that inflation is showing signs of reducing, thanks to reductions in gas prices and easing of supply-chain problems. They believe that it is on track to go down to 4% from the current 8%-9% in the coming months. But that’s still much higher than we’ve been used to, and the Federal Reserve wants to see it go down to 2%. To get to that level, the Federal Reserve will likely continue to increase interest rates steadily over the coming months in an effort to slow the current growth in the economy and cool off current spending levels, both of which are contributing to inflation.
If they hit it right, we’ll see a gradual slowdown that will return us to more normal levels of growth. If they apply the brakes too hard, we’ll go into a recession, likely beginning the second half of 2023—a relatively mild recession, but a recession nonetheless, leading to layoffs, increased unemployment, and a significant reduction in tax revenues. At this point, OEA believes that the former scenario (a gradual, slowdown, which they call the “Soft Landing”) is more likely and is being considered the “baseline” scenario; however, there’s a good chance that the latter (mild recession) could take place.
So, this revenue forecast—very unusually—includes two scenarios: the more likely gradual slowdown and the possible mild recession. It covers the current biennium, along with the next three. (The farther out it goes, the more speculative the numbers.)
Under the Soft Landing scenario, we’ll see a small drop in projected revenues over this and the next biennium of $144 million. Under the recession scenario, the drop would be much more significant: nearly $1.2 billion for 2021-23 and 2023-25 combined.
Ten years ago the latter level of reduction would have been catastrophic, leading to widespread reductions in crucial government programs that are particularly needed during a recession. Fortunately, we’re in a better place now. I’m proud to say that over the last 12 years, beginning with the Great Recession of 2009 that required huge budget cuts (which coincided with my entry into the Legislature!), legislators and governors have been very disciplined in building up our General Fund reserves. As a result, we should be able to get through a potential downturn with the resources needed to provide Oregonians with the services they need.
At this point, we are looking at the following reserves at the end of this biennium:
Education Stability Fund $ 704 million
Rainy Day Fund 1.314 billion
Ending Fund Balance 3.711 billion
Total 5.731 billion
% of General Fund 20.5%
Here are the PowerPoints from the Forecast presentation. You can link to a video of the presentation from this page.
For those of you interested in the detailed economic forecast narrative, with economic and demographic appendices, here it is. And here is the full, detailed revenue forecast narrative.
And here is the OEA Blog, summarizing the latest findings.
Here are some of the details of the presentation:
- The economic and jobs slowdown that was predicted three months ago has clearly not yet happened in Oregon.
- 2021-23 net General Fund resources are up $589.1 million from the June 2022 forecast.
- All the state revenue funds (including personal income tax, corporate income tax, capital gains tax, lottery, marijuana, and others) are currently continue to exceed expectations.
- A personal kicker of $3.461.4 billion is now projected for 2023.
- The projected corporate kicker is now $1.104.6 billion. Thanks to a voter-approved constitutional change in 2012, the corporate kicker will go to add additional dollars to K-12 funding in 2023-2025.
- Oregon’s economy is currently growing at 5%, a level that “many states would kill for.” However, this is lower than it’s been, which is actually a good thing if we’re hoping for a soft landing.
- Some of this growth is likely a function of inflation.
- Oregon’s economic growth has been tied to the number of people moving into the state. Economists will be watching closely to see if the outmigration that most large cities experienced during the pandemic (including Dallas, Nashville, Seattle, San Francisco, and Orlando) is starting to reverse. We should know more about that in the next few weeks.
- The growth in inflation will lead to an increase in Oregon’s statewide annual cap on rent increases—which is 7% plus inflation. OEA believes it could be as high as 14%, though of course not all landlords will go that high. This will create added pressure on many households and may require more support from the state.
- While inflation is helping to create an increase in our state revenues, it will also increase the amount we will need to run our programs and to fulfill infrastructure projects. It’s a two-edged sword.
- Careful management of our reserves has gotten us to where we can withstand a downturn, but we will need to continue to be careful with them.
ON THE COVID FRONT
Weekly Data Report:
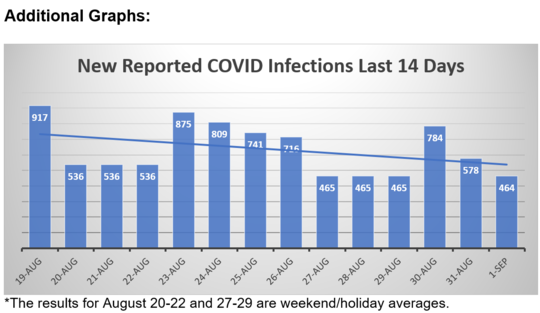
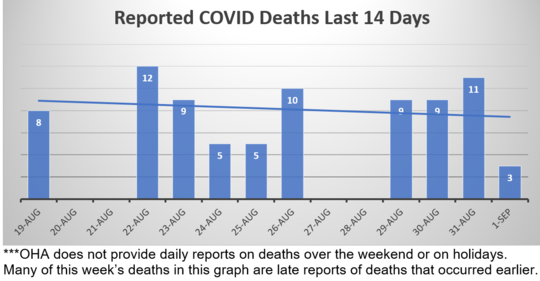
Here is what this last week looks like in Oregon, based on information gleaned from OHA's daily reports. At the end of the newsletter you’ll find graphs that I’ve put together showing the daily counts and trends for the last two weeks.
Overall, all the chief COVID metrics--infections, test positivity, hospitalizations, and deaths have gone down in the last week. We appear to be in line with the latest OHSU forecasts, continuing on the downslope of the “Omicron COVID Crest.”
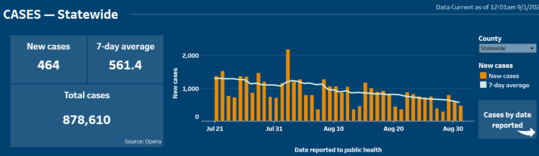
- The number of reported infections has dropped over the last week. OHA reported 3,937 new cases of COVID-19 during the week of August 19-25 (vs. 4,950 the week before), a 7-day average of 562 per day (vs 707 the previous week). The number of new cases is again likely an undercount, as many people are using home tests to determine their infection status but are not reporting those results.
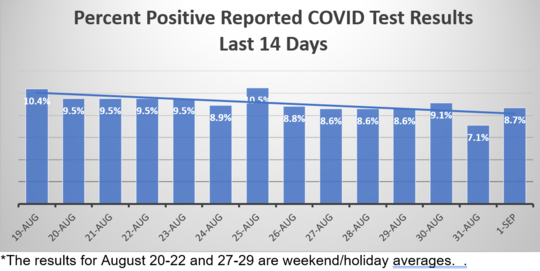
- Average test positivity for the last week was 8.5%, down from the previous week’s 9.7%. Again, this number skews high because it likely reflects a higher proportion of people showing COVID symptoms (and thus going in for a test, rather than self-testing).
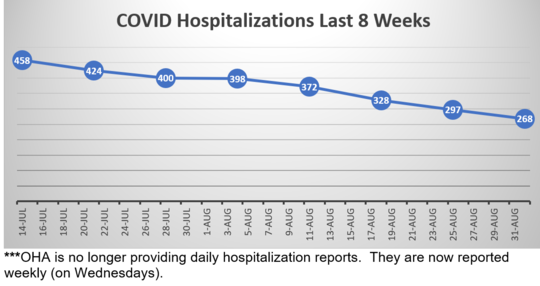
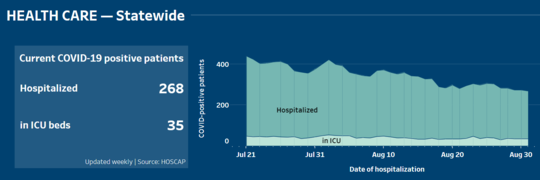
- On Wednesday there were 268 COVID-19-related hospitalizations statewide, vs. 297 last Thursday. Hospitalizations are now our best indicator of disease spread. Again, however, most of these hospitalizations are not in and of themselves due to COVID—more than half are those who tested positive after having been admitted for other reasons.
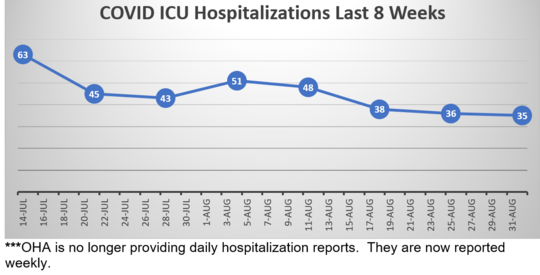
- The number of COVID patients in Oregon’s ICUs has gone down again slightly over the last week: 35 on Thursday, down from last week’s 36. These are the most serious COVID infections.
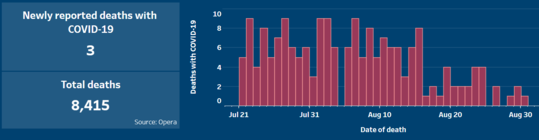
- There were 42 COVID-19-related deaths reported during the last week, vs. 39 last week. Again, some of these deaths actually occurred in earlier weeks but were just reported to the state.
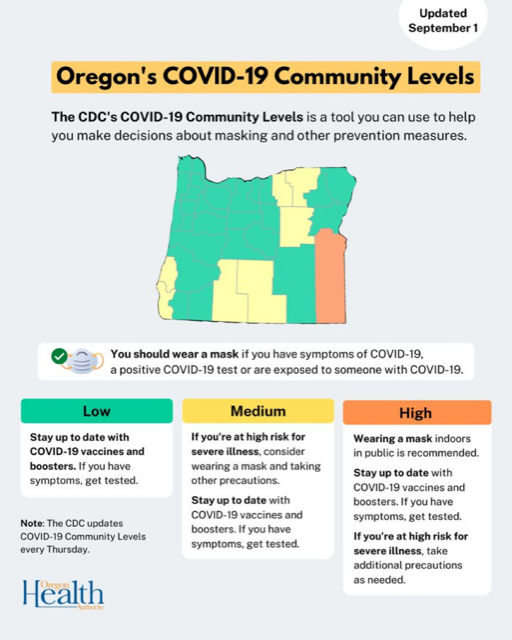
Weekly County Report: 28 Out of 36 Counties Now at Low Risk
According to the CDC Daily Counter (updated each Thursday), just 1 Oregon county (down from 2 last week) are now at high risk of COVID transmission: Malheur in far Eastern Oregon. The CDC assigns these risk levels based on a combination of the number of new COVID cases and the number of people in hospital for COVID.
Here’s what the CDC recommends for this category: Stay up to date with COVID-19 vaccines. Get tested if you have symptoms. Wear a mask if you have symptoms, a positive test, or exposure to someone with COVID-19. Wear a mask on public transportation. You may choose to wear a mask at any time as an additional precaution to protect yourself and others. If you are at high risk for severe illness, consider wearing a mask indoors in public and taking additional precautions.
Seven Oregon counties (down from 14 last week) have reported infection rates that place them in the Medium Risk category: Baker, Coos, Curry, Grant, Jefferson, Klamath, and Lake.
Twenty-eight Oregon counties (up from 21)— Benton, Clackamas, Clatsop, Columbia, Crook, Deschutes, Douglas, Gilliam, Harney, Hood River, Jackson, Josephine, Lane, Lincoln, Linn, Marion, Morrow, Multnomah, Polk, Sherman, Tillamook, Umatilla, Union, Wallowa, Wasco, Washington, Wheeler, and Yamhill—are now at Low Risk.
We can also track the test positivity rates for each county at this dashboard. The test positivity rates reported this week show continued increases.
At 7.6%, Multnomah County shows a reduction from last week’s 8.6%. Clackamas County is 6.9%, down from last week’s 7.4%. Washington County is now the lowest of the three Metro counties at 6.8% (down from 9.3%).
This Week’s Wastewater Monitoring Report Shows No Increases, Continuing Plateaus in Oregon Cities
With testing reports giving us just a fraction of infections out there, wastewater monitoring has become a more reliable indicator of the amount of virus in cities around the state. That report is updated each week.
This week’s report shows us that nearly all cities again show little change in the amount of virus in their wastewater. The exceptions are all decreases in virus levels.
Of the cities monitored, 3% showed decreases (same as last week), 10% showed sustained decreases (vs. 3% last week), 0% showed increases (vs. 5% last week), 0% showed sustained increases (same as last week), and 90% remained on a no-change plateau (vs. 90% last week).
OHSU Forecast: Downward COVID Slope Continues
The latest OHSU Forecast Report, published on Friday, uses data provided by OHA and others that project how fast the virus may spread in the population and provides projections on possible outcomes, including infection rates and impacts on hospital capacity. The lead author is Dr. Peter Graven, Director of OHSU’s Office of Advanced Analytics.
It now appears every two weeks.
This week’s report confirms that the recent surge has peaked and is continuing to recede. The forecast is largely unchanged from the last report.
- As of Sept. 1, 263 people were in Oregon hospitals with COVID. That's a 44% drop from the peak of 464 on July 17.
- Most of these hospitalizations were not primarily for COVID, but were “incidental” cases, i.e., patients who tested positive upon admission but were there for another reason. The incidental share is expected to increase mildly from 60 to 64% during the forecast period.
- Three children were in Oregon hospitals. That’s 19 fewer than the peak of 22 on June 20.
- As of Aug. 31, 6% of intensive care beds are filled with COVID patients.
- Despite the reduction in the number of COVID patients, staffed hospital beds remain limited: statewide, the number of available beds decreased from 382 in last report to 372 on 8/24. Some of this limitation can be attributed to a lack of staff in skilled nursing facilities, preventing patients from being discharged.
- Test positivity fell to 9.2%, continuing a decline.
- At 14 per 100k per day, Oregon has the 5th lowest case rate in the nation.
- Wastewater testing shows that all cities are below the peak of the BA4/5 wave, but they are not as low as the trough after the BA1 wave in the spring.
- The national decline has slowed and most regions appear flat.
- The current wave in Oregon is expected to fall through September, with 129 people in hospitals on Sept. 21, before starting to climb again in October.
- The number of deaths per day is expected to decline over the next 2 months.
- While infections are expected to decline, standard waning of immunity is expected to generate a fall increase in infections. This may be mitigated by a vaccine booster. When the details of the vaccine become clearer, the impact will be added to the model.
- South America, like Australia (both of which are coming to the end of their winter), has seen a strong flu season, highlighting the need for flu and COVID vaccines heading into fall.
- A CDC fall forecast is expected by the end of the month.

Additional COVID Updates and Links
Here again are some COVID resources that you will find useful:
If the above links are not providing you with answers to your questions or directing you to the help that you need, please consider me and my office to be a resource. We’ll do our best to assist you or steer you in the right direction.
Want to See Past Newsletters?
If there was COVID-related information in a past newsletter that you want to go back to, but find you’ve deleted it, you can always go to my legislative website (senatordembrow.com), click on “News and Information,” and you’ll find them all there. Also, if someone forwarded you this newsletter and you’d like to get it directly, you can sign up for it there.
Best,
 Senator Michael Dembrow
District 23
email: Sen.MichaelDembrow@oregonlegislature.gov
web: www.senatordembrow.com
mail: 900 Court St NE, S-407, Salem, OR, 97301
|