|
May 20, 2022
Dear Neighbors and Friends,
I hope that you and your loved ones are doing well, staying healthy, and looking out for your neighbors and friends during this past week.
In tonight’s newsletter you’ll find details about the state’s new revenue forecast, received by legislators Wednesday morning. It’s once again a very positive forecast, predicting record state tax revenues, as a result of a strong economy, strong business profits, and tax decisions made last year by wealthier Oregonians. As a result of Oregon’s unique (!) kicker law, most of the increased revenues will go back to tax payers at the end of the 2023-25 biennium (ironically, right when we once again may be in a recession).
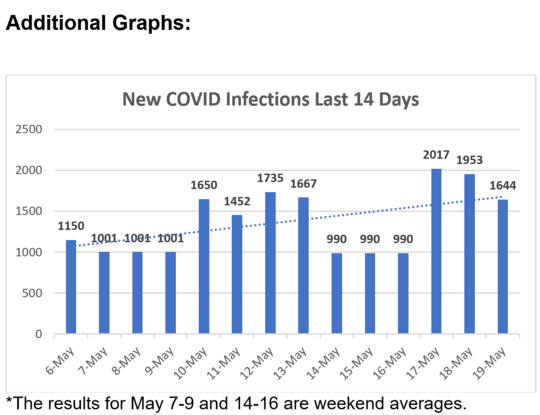
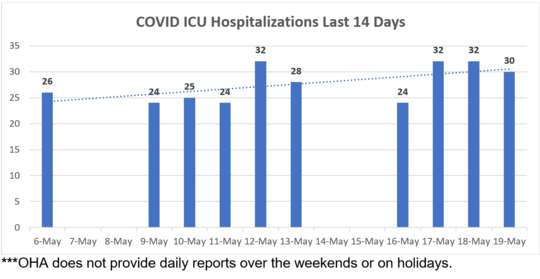
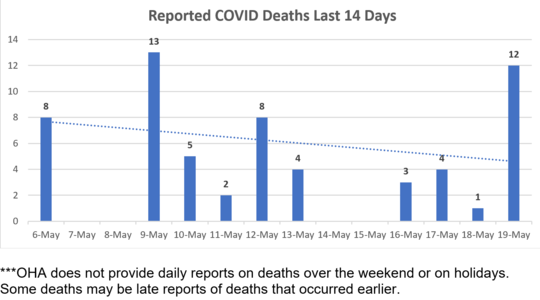
On the COVID front, infection rates are continuing their projected increase, as are hospitalizations. In general, we remain pretty much on track with the recent forecasts from OHSU. OHSU is still predicting that the current increases in cases and positivity rates will peak in the second week of June and then steadily decline. Fortunately, the number of those currently in the ICU for COVID remain very low, as do COVID deaths. Vaccinations and antiviral treatments appear to be making a difference.
You’ll find details on all of these developments in this newsletter, along with the links and graphs that will clarify the current status of the pandemic for you.
Until the next newsletter, please stay healthy and safe. And let me know if you have any questions or thoughts about anything in tonight’s newsletter.
Another Positive Revenue Forecast for Oregon: More Revenue, More Kicker
The House and Senate Revenue committees heard a presentation from Mark McMullen and Josh Lehner from the state’s Office of Economic Analysis (OEA) on Wednesday morning. It began with an overall look at the economy in the U.S. and in Oregon, then went into the impact on state tax revenues and the state budget.
The forecast shows that projected tax revenues continue to increase—for now at least: $427 million more net resources for the 2023-25 biennium relative to the most recent forecast in March 2022 forecast. It also will lead to a higher kicker in 2023-24.
Here are highlights of the presentation.
- The Oregon OEA’s economic advisors and consultants believe that our economic fundamentals remain sound, though it’s likely that we’ll experience a “soft-landing” recession sometime in the next two years.
- We are pretty much back to full employment following the COVID recession.
- While the recovery has not increased income disparities based on race, gender, or age, it has widened disparities based on education level and household wealth (homeownership, investments, and savings).
- Fewer Oregonians are having to work multiple part-time jobs.
- Labor shortages persist, a result of demographics, COVID deaths, reduced immigration, and workers quitting.
- Other concerns: inflation (which may be starting to come down), the impact of the war in Ukraine on gas prices, and ongoing (temporary?) supply-chain challenges.
- Inflation is counteracting the benefits of long-awaited wage increases.
- Despite the overall solid fundamentals, Oregonians are pessimistic, which could in and of itself help provoke a downturn.
- The Federal Reserve is increasing interest rates, which will dampen investment and home purchases.
- Inflation can help bring down household debt (when inflated dollars are used to pay down fixed-interest debt).
- The shock of having to resume college loan payments (frozen during the pandemic) will be a challenge for many.
- As is the case for all income-tax states, revenues in Oregon have come in much higher than expected.
- Our tax revenues this year have come in $1.2 billion (70%) higher than in 2001, which was already a record year.
- Most of the increases are coming from high-income (mainly via capital-gains taxes) and corporate filers.
- Although the economic fundamentals remain strong and led to higher revenues, much of the increase was a result of taxpayer behavior: for various reasons, high-income filers chose to cash in a wide range of assets in 2021 (e.g., fear that the new Biden administration would raise taxes in 2021), creating more taxable income.
- Inflation is creating some of these increases; we must remember that our expenditures will also be higher than expected.
- “Bracket creep” as a result of inflation is also a factor. The number of those paying at the highest rate is increasing.
- We cannot expect these factors to continue, particularly if a recession does occur. Although the forecast doesn’t include a collapse, it assumes that most of the increases are temporary.
- But some are assumed to continue to a large extent (Corporate Income Taxes, Estate taxes).
- Overall, the increases are projected to slow way down in the 2023-25 biennium.
- With the record kicker projected to be paid out next biennium, we’re projected to see a net reduction in income next biennium.
- The individual kicker is now projected to be $3.033 billion. It will go back to taxpayers.
- The Corporate Kicker is projected to be $931 million. As directed by the Constitution, it goes into the State School Fund.
- Based on past business cycles, the next recession will likely come in 2023 and 2024.
- Oregon’s total budget reserves at the end of this biennium are projected to be $5.125 billion, or 18.7% of the General Fund (up from 17.7% in the previous forecast). This record amount, in large part the result of mandatory savings the Legislature instituted in 2009, should help us to get through this potential recession.
Here's the PowerPoint from the presentation, including the state and national analysis of current economic trends, along with projections for the future.
And here are the charts summarizing the forecast.
And here's a nice write-up on the new forecast from the Oregonian’s Hillary Borrud.
Please let me know if you have any questions about the forecast, the kicker (yes, it is in the Oregon Constitution), and the presentation.
ON THE COVID FRONT
COVID Update from Dr. Sidelinger
Oregon's State Epidemiologist, Dr. Dean Sidelinger, held a media availability on Wednesday to provide an update on where Oregon is in terms of the current increase in COVID cases and answer reporters' questions.
Here are the Dr. Sidelinger’s talking points from Wednesday’s media availability. If you’re interested in seeing all the Q&A’s from reporters, you can also watch it here,
OHA Biweekly Report: Increases in New Cases and Deaths, Reductions in Hospitalizations
This is the week that OHA releases its COVID-19 Biweekly Data Report. As usual, this one was released on Wednesday. It shows an increase in cases and COVID-19-related deaths and a decrease in COVID-19-related hospitalizations since the previous biweekly period.
- OHA reported 18,447 new cases of COVID-19 from May 2 to May 15, a 51% rise over the previous biweekly total of 12,234.
- There were 208 new COVID-19-related hospitalizations during the biweekly period, down slightly from 218 reported during the previous two-week period.
- There were 58 COVID-19-related deaths, up slightly from the 50 reported during the previous two weeks.
- There were 193,475 tests for COVID-19 administered during the weeks of May 1 to May 14, up from 173,792 the two weeks before.
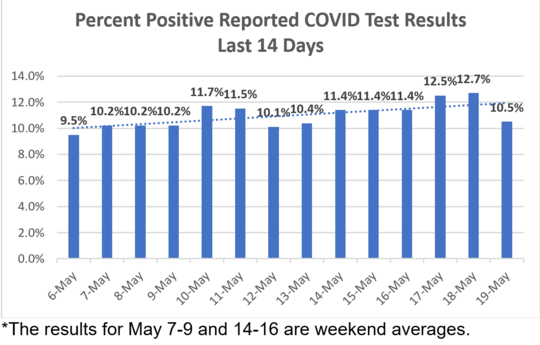
- The test positivity rate for the last two weeks was 10.5%, up from 7.5% for the previous two weeks.
Wednesday’s COVID-19 Biweekly Outbreak Report shows 104 total active outbreaks in care facilities, senior living communities and congregate care living settings, an increase from 58 during the previous 2-week period. There were just 18 deaths in congregate care settings over the last two weeks, an increase from the 9 deaths reported during the previous 2 weeks.
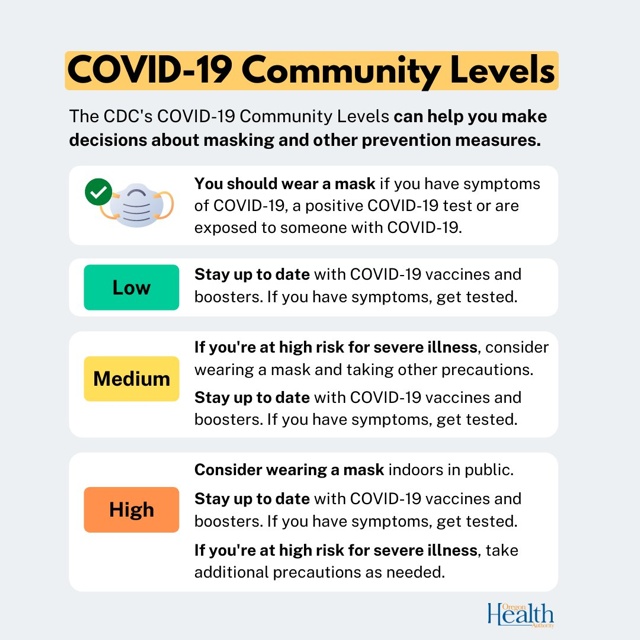
Weekly County Report: Seven More Counties Now at Medium Risk
OHA is no longer providing a weekly county report each Monday, but there are still ways to track this data. According to the CDC Daily Counter (updated each Thursday), 13 Oregon counties have reported infection rates that place them in the Medium Risk category: Columbia, Tillamook, Lincoln, Polk, Benton, Lane, Deschutes, Union, Wallowa, Baker, Hood River, Multnomah, and Washington. The remaining 23 Oregon counties remain at Low Risk.
Again, we must remember that these are only the tests results that are reported. With the prevalence of home tests, there are certainly many more positive cases out there that have not been reported.
Here’s what the CDC recommends for this category: Stay up to date with COVID-19 vaccines. Get tested if you have symptoms. Wear a mask if you have symptoms, a positive test, or exposure to someone with COVID-19. Wear a mask on public transportation. You may choose to wear a mask at any time as an additional precaution to protect yourself and others. If you are at high risk for severe illness, consider wearing a mask indoors in public and taking additional precautions.
We can also track the test positivity rates for each county and the state as a whole at this dashboard. The test positivity rates reported this week show continued increases.
Among the reported cases, the statewide infection rate has risen from 11.5% last week to 12.8% this week.
At 14.0%, Multnomah County is again above the state average, increasing from last week’s 12.0%. It is slightly below the the Portland Tri-County average, which is now 14.1% (up from last week’s 13.2%).
This Week’s Wastewater Monitoring Report Shows Steady Increases in an Increased Number of Cities
With testing reports giving us just a fraction of infections out there, wastewater monitoring has become a more reliable indicator of the amount of virus in cities around the state. That report is updated each week.
This week’s report shows us that the following cities are showing sustained increases: Durham, Portland, McMinnville, Newport, Bend, Redford, Grants Pass, and Ashland.
OHSU Forecast Relatively Unchanged; Hospitalizations Peaking June 9th
The current OHSU COVID report and forecast, published this morning, uses data provided by OHA and others that project how fast the virus may spread in the population and provides projections on possible outcomes, including infection rates and impacts on hospital capacity. The lead author is Dr. Peter Graven, Director of OHSU’s Office of Advanced Analytics. It appears every two weeks.
This forecast shows very little change from the one that was issued two weeks ago.
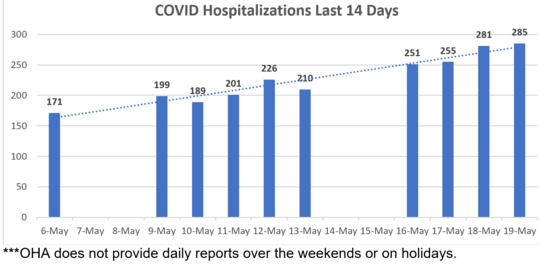
The current forecast predicts a gradual increase in hospitalizations (currently 281, up by 100 from two weeks ago), peaking at 329 by June 9th. However, it is worth noting that many if not most of those are not being admitted for COVID but have tested positive upon admission (which does make their in-hospital treatment more complicated). However, even at this level, COVID hospitalizations should still remain well below danger levels for our hospitals.
Here are key observations in this week’s report:
- Oregon cases levels are about middle of the pack (26th in US) and appear to be cresting.
- As of May 19, 281 people were in Oregon hospitals with COVID-19, an increase of 100 since May 4.
- Most regions are seeing mild increases in hospitalized patients but at levels well below delta and omicron peaks.
- Wastewater levels have switched to generally showing plateaus, increases, or sustained increases.
- As of May 20, 5% of occupied ICU beds had COVID patients in them statewide. This has not changed from levels reported two weeks ago.
- Five children were in Oregon hospitals, the same as in the last report.
- The week ending May 14 had a test positivity of 10.9%.
- Due to the high prevalence of infections and low hospitalization rate per infection, a significant share of hospitalizations are expected to be incidental.
- Many strains of omicron are present in Oregon. BA2 and its sub-strains make up about 90% of the currently circulating virus in Oregon.
- Masking levels have remained stable since early April.
- The primary forecast shows a slight increase in hospitalized patients as the impacts of BA2 and reduced COVID restrictions are experienced. The peak is shown as 329 on 6/9/2022.
Additional COVID Updates and Links
- The CDC's Advisory Committee on Immunization Practices (ACIP) is recommending that children 5-11 get a COVID booster shot.
- This recommendation was just confirmed by the Western States Scientific Safety Review Workgroup, which coordinates COVID response for the West Coast states.
- Oregon state health officials are urging Oregonians in some counties to consider masking in indoor public spaces.
- The U.S. Department of Health and Human Services announced that it will again be extending the COVID-19 public health emergency.As a result of the recent uptick in infections, the federal emergency policies, including medical coverage and access to free testing and vaccines, will be extended to mid-July.
- In fact, the federal government is offering us another round of free COVID tests.
-
Nature reports on a new study showing that the antibodies created by an unvaccinated person in response to a case of Omicron can protect against Omicron but not against other variants. Vaccination do better against the many variants of COVID.
-
And here's more evidence that the mRNA vaccines have proven much more effective at combating the many variants of COVID than non-mRNA vaccines.
-
U.S. demand for Paxlovid and other antivirals has increased more than 300% in the last four weeks response to the increase in infections.
- How big is the current COVID wave in the U.S.? As a result of home testing, no one really knows.
- We know that immunocompromised people run a higher risk of more serious COVID infections, but this opinion piece argues that the risk may not be as high as many headlines would have us believe.
- Here’s an interesting question: Can dogs be trained to sniff out COVID in travelers?Results of a test show strong evidence that the answer is yes.
- Researchers are continuing to work on a vaccine that comes in the form of a nasal spray. stopping the virus before it even enters the body.
- How often can you be infected by the Coronavirus? Unfortunately, the answer appears to be many times.
- The Cleveland Clinic is urging medical professionals to pay attention to potentially serious comorbidities and unusual presentations for COVID in geriatric patients.
- We recently passed the awful threshold of 1 million COVID deaths in this country. The New York Times takes a close look at how that came to be.
- And here's a similar examination from the Washington Post.
- As we come to know more about “long COVID,” it appears that ¾ of those who’ve been inflicted with this disease were never hospitalized with the disease..
- New studies suggest, though, that vaccinations significantly reduce the chances of Long Covid.
- Federal health officials are warning of substantial increases in COVID infections.
- The CDC is again suggesting that travelers be tested for COVID.
- After more than a year of COVID vaccines being available, pro-Trump counties continue to die at much higher levels from COVID-19.
Here again are some COVID resources that you will find useful:
If the above links are not providing you with answers to your questions or directing you to the help that you need, please consider me and my office to be a resource. We’ll do our best to assist you or steer you in the right direction.
Want to See Past Newsletters?
If there was COVID-related information in a past newsletter that you want to go back to, but find you’ve deleted it, you can always go to my legislative website (senatordembrow.com), click on “News and Information,” and you’ll find them all there. Also, if someone forwarded you this newsletter and you’d like to get it directly, you can sign up for it there.
Best,
 Senator Michael Dembrow
District 23
email: Sen.MichaelDembrow@oregonlegislature.gov
web: www.senatordembrow.com
phone: 503-281-0608
mail: 900 Court St NE, S-407, Salem, OR, 97301
|