|
April 24, 2021
Dear Neighbors and Friends,
I hope that you and your loved ones are doing well, staying healthy, and looking out for your neighbors and friends in these difficult times.
Today is another bad day/ good day for COVID. The case count is high, as is today’s positivity rate. Hospitalizations have jumped again, just a few beds shy of the 300 mark that will trigger a move to Extreme Risk status as soon as Friday. Here are the counties on track to move to Extreme Risk this week:
Baker
Clackamas
Columbia
Crook
Deschutes
Jackson
Josephine
Klamath
Marion
Polk
Here's a chart that shows the requirements for the different risk levels.
In tonight’s newsletter you’ll find the most recent epidemiological forecast for Oregon. The forecast is not good, likely a continuation of the expansion of the disease for the next few weeks. The question is, will enough Oregonians get vaccinated
On the good-news side, reported daily vaccinations set a new record today. Well over three hundred thousand doses were received in Oregon this week. By all accounts, the recent expansion of eligibility to include all those sixteen and over has gone relatively well.
Please stay safe, and let me know if you have any questions about information in today’s newsletter.
TODAY’S CORONAVIRUS AND CORONAVIRUS RESPONSE UPDATE
-
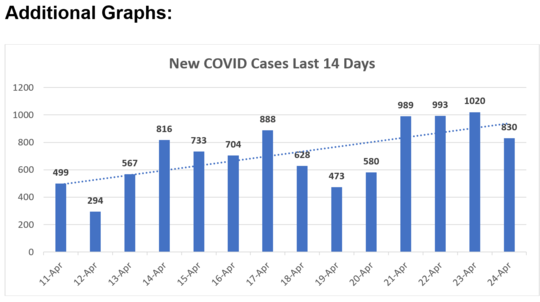
New COVID Cases: OHA reports 830 new COVID cases today. The cumulative number of cases in Oregon since the beginning of the pandemic is 179,930.
-
Variant COVID Cases: OHA is now producing a Variant Tableau dashboard providing current variant case numbers for the state as a whole and for various parts of the state. The reported numbers remain the same: 112 (up from 69) cases of the B.1.1.7 (UK) variant, 7 cases (up from 4) of the P.1 (Brazilian) variant, and 10 (up from 8) cases of the B.1.351 (South African) variant. In addition, we are now seeing 140 (up from124) cases of the B.1.427 variant, and 479 (up from 474) of the B.1.429 variant.
-
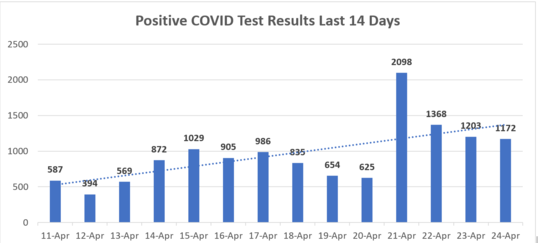
Positive Test Results: OHA reported 1,172 positive tests today. The cumulative total of positive test results since the beginning of the pandemic is now 260,138.
-
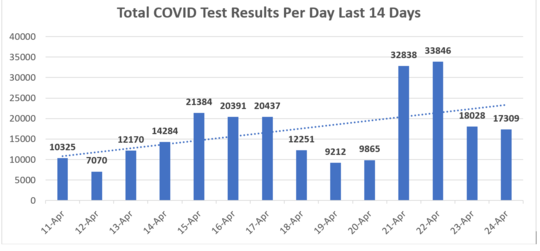
Total Tests: OHA reported an additional 17,309 tests today. Our cumulative total of reported tests is now 4,595,697.
-
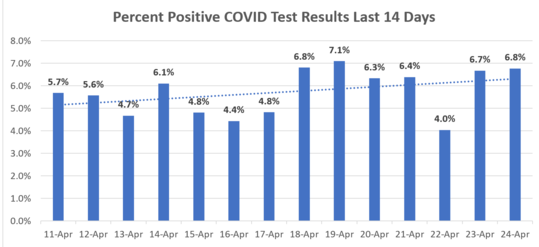
Positivity Rate: The test positivity ratio for Oregon today is 6.8%.
-
Hospitalization Information: OHA only reports on the first two bulleted items over the weekend. I’ll catch you up on the other metrics on Monday.
- Patients Currently with Confirmed COVID-19: 295 (19 more than yesterday)
- ICU Patients Confirmed w COVID-19: 66 (2 more than yesterday).
- Available ICU Beds: 148 (8 more than yesterday)
- Other Available Beds: 543 (30 more than yesterday).
- Confirmed COVID-19 Patients Currently on Ventilators: 27 (3 fewer than yesterday).
- Available Ventilators: 798 (14 fewer than yesterday).
-
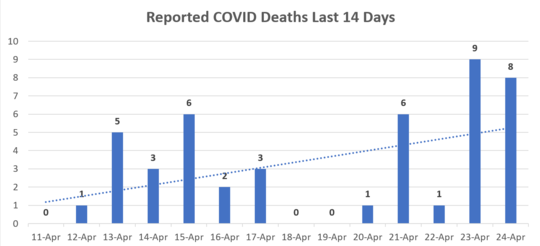
Deaths: I’m sorry to report 8 additional COVID deaths today. The total number of COVID deaths in Oregon is now 2,484.
-
Vaccinations:
- As of the end of yesterday, here are the latest numbers:
- New Immunizations Reported Today: 53,765
- 29,160 were conducted yesterday
- 24,605 were conducted earlier, but the reports were received yesterday (there can potentially be a three-day window for reporting)
- The 7-day running average is now 35,236 doses per day.
- Total First and Second Doses Administered So Far: 2,765,408
- 1,452,245 Pfizer doses
- 1,220,017 Moderna doses
- 91,966 Johnson & Johnson doses
- Total Oregonians vaccinated so far: 1,709,184
- 1,144,023 now fully vaccinated with two doses
- To date, 3,400,415 doses of vaccine have been delivered to sites across Oregon. (That’s 53,170 more than was reported yesterday, for a total of 331,690 for the week so far.)
-
Additional Brief Updates:
- OHA has just released revised guidelines for youth sports. Check them out here.
- We’re only now coming to fully appreciate what a toll COVID has taken on our lives. The New York Times has an article full of graphs showing just how this was the worst year for U.S. mortality since the Flu Pandemic of 1918.
- It’s so tempting to let down one’s guard after receiving that first dose of the vaccine. Unfortunately, many Americans are catching COVID at exactly that moment—between the first dose and full immunity.
- As in so many things, there is a clear gender difference with respect to willingness to seek a COVID vaccine. Guess which way it goes? Here's your answer.
- The Washington Post examines a related problem: the reluctance of Black males in particular to seek a vaccine. Here's more.
-
This one was from yesterday, but the link was flawed. As I’ve mentioned, legislators will be given the ability to designate dollars for American Rescue Plan projects in their districts. Each senator will be able to designate $4 million in projects and each representative $2 million. Here’s an OPB article with more.
Latest Epidemiological Forecast Released: Ongoing Concern
OHA has released its latest COVID-19 forecast, with support from the Institute for Disease Modeling. It reflects information collected up to April 13. It underscores what we’ve been seeing in the daily reports: significantly higher transmission of the virus through early April and an increase in cases and hospitalizations. The Re (effective reproduction rate)--the expected number of secondary cases that a single case generates — was estimated at 1.24 (up from 1.12) through April 7. This is another big increase over the rates that we had been seeing since the beginning of the year—rates that had been consistently below 1.0, which had been driving our case counts down. For now, we are seeing the reverse.
We are currently experiencing the “worst-case” scenario from the previous forecast.
The report finds that the 7-day rolling average of diagnosed cases has been increasing since mid-March. New hospitalizations increased between mid-March and early April and then seemed to level off through April 13. The number of deaths had been declining for several months, but this trend too started to reverse in early April.
Why are we (and many other states) experiencing this increase in transmission rate right now? Here is an explanation from the forecast: It is important to note that the changes in Re over time may be due to some combination of changing behaviors, changes in opportunities for potential exposure as counties’ interventions become more or less stringent, viral infectivity [i.e., prevalence of more-infectious variants], and/or immunity (either from vaccination or recovering from infection). In addition, these Re estimates are based on averages statewide, but the growth in cases in Oregon has varied by county, race, ethnicity, and age.
The revised forecast this time gives us only two possible scenarios for the immediate future. I regret to observe that this time there is not a scenario that envisions a reduction in transmission over the next two weeks.
Scenario 1: Transmission Continues As-Is
If the transmission rate as estimated for April 7 (Re 1.24) persisted, we would see a continued rapid increase in diagnosed cases:
- For the two-week period between April 28 and May 11, the projected number of new diagnosed cases would rise to 320 per 100,000 people. This rate translates to a daily average of 960 cases. That’s triple the rate from the previous “as-is” forecast.
- New hospitalizations would increase to 38 per day by May 11. That’s 2.25 times the rate from the previous “as-is” forecast.
Scenario 2: Transmission Increases by 20%
This scenario is intended to illustrate what might happen over the next month if the transmission were to increase due to continuing spread of more infectious variants, and if increased infectivity was not offset by people adopting more protective behaviors:
- New diagnosed cases would reach 540 per 100,000 people for the two-week period between April 28 and May 11; this rate translates to a daily average of 1,610 cases.
- New hospitalizations would increase to 66 per day by May 11. The results for this latter scenario are more consistent with current trends in hospital occupancy over the last week.
The latest analysis points to data showing that mask-wearing in Oregon is continuing to go down, as is social distancing (now projected to be at its lowest level since March 2020), while travel and mobility are increasing. They modelers believe that it is likely that these behaviors are helping to drive up the numbers. Even more troubling than the increase in cases is the increase in COVID hospitalizations, which continued to increase substantially in the week following the cutoff point for the data used in the model.
As you can see from these scenarios, until the vaccines are fully deployed over the next couple of months, it will be important for people to remain careful and hold on a little longer. That’s the way to keep themselves, their neighbors, and their loved ones safe until vaccinations have hit the 70% mark at least.
Where Are Today’s New Cases?
If we put together the positive test results and new “presumptive cases reported today, the overall number of new cases reported is 830. Here is today’s breakdown by county:
Baker (6)
Benton (12)
Clackamas (106)
Clatsop (1)
Columbia (7)
Coos (5)
Crook (8)
Curry (1)
Deschutes (103)
Douglas (11)
Harney (1)
Hood River (2)
Jackson (47)
Jefferson (3)
Josephine (12)
Klamath (38)
Lake (1)
Lane (70)
Lincoln (6)
Linn (34)
Malheur (1)
Marion (65)
Morrow (1)
Multnomah (130)
Polk (10)
Tillamook (6)
Umatilla (8)
Union (3)
Wallowa (1)
Wasco (6)
Washington (117)
Yamhill (24)
And the Deaths:
You’ll see that all but one of today’s 8 reported deaths is a “catch-up” report about a death that occurred many weeks or months ago.
Oregon’s 2,477tsh death is a 69-year-old man from Clackamas county who tested positive on March 22 and died on March 27 at Portland Adventist Medical Center. \
Oregon’s 2,478th death is a 61-year-old man from Coos county who tested positive on April 16 and died on April 22 at Bay Area Hospital.
Oregon’s 2479th death is a 75-year-old man from Douglas county who tested positive on Oct. 22 and died on Nov. 23 at his residence.
Oregon’s 2,480th death is a 68-year-old man from Hood River county who tested positive on March 21 and died on March 26 at his residence.
Oregon’s 2,481st death is a 91-year-old man from Marion county who tested positive on Sept. 4 and died on March 5 at his residence.
Oregon’s 2482nd death is a 91-year-old woman from Multnomah County who tested positive on Nov. 23 and died on March 2 at her residence.
Oregon’s 2483rd death is a 71-year-old man from Multnomah county who tested positive on Dec. 10 and died on March 7 at his residence.
Oregon’s 2484th death is a 46-year-old man from Multnomah county who tested positive posthumously on Dec. 17 and died on Dec. 14 at his residence.
Want to See Past Newsletters?
If there was COVID-related information in a past newsletter that you want to go back to, but find you’ve deleted it, you can always go to my legislative website (senatordembrow.com), click on “News and Information,” and you’ll find them all there. Also, if someone forwarded you this newsletter and you’d like to get it directly, you can sign up for it there.
AND FINALLY,
Here again are some resources that you will find useful:
If the above links are not providing you with answers to your questions or directing you to the help that you need, please consider me and my office to be a resource. We’ll do our best to assist you or steer you in the right direction.
Best,
 Senator Michael Dembrow
District 23
email: Sen.MichaelDembrow@oregonlegislature.gov
web: www.senatordembrow.com
phone: 503-281-0608
mail: 900 Court St NE, S-407, Salem, OR, 97301
|