|
December 5, 2020
I hope that you and your loved ones are doing well, staying healthy, and looking out for your neighbors and friends in these difficult times.
COVID case numbers are again very high today for Oregon and the nation as a whole. The same is true for death rates. We don’t get hospitalization numbers for Oregon over the weekend, but OHA reports that they are up. That comes as no surprise, unfortunately. We’ll get the exact numbers on Monday.
As I do on Saturdays, I’m also including an update on what’s going on in the counties. You’ll find the latest weekly figures for case rates, positivity rates, and death rates for each of the counties below. You’ll also find the latest modeling update, along with a report on the latest OHA Weekly Update.
All of the trends, not surprisingly, are bad.
Please stay safe, and let me know if you have any questions about today’s newsletter.
TODAY’S CORONAVIRUS AND CORONAVIRUS RESPONSE UPDATE
-
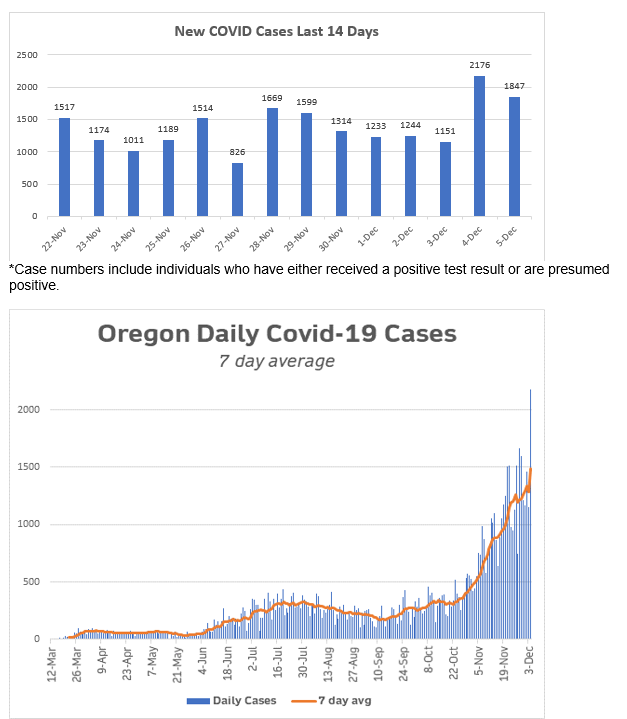
New COVID Cases: OHA reports 1,847 new COVID cases today. This count is a combination of positive test results and those who are presumed positive (see definition below). The cumulative number of cases in Oregon since the beginning of the pandemic is 83,243.
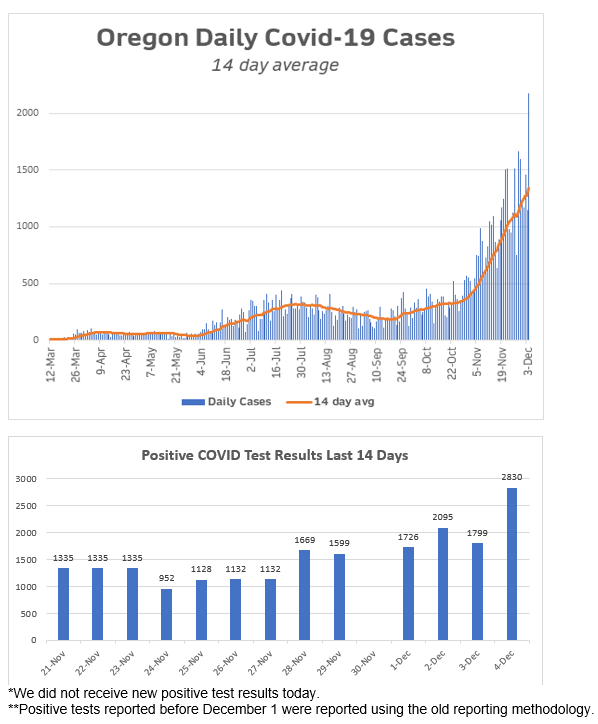
- .Positive Test Results: OHA does not report on positive test results over the weekend. The cumulative total of positive test results since the beginning of the pandemic thus remains at 117,021. I’ll be able to update these numbers on Monday.
-
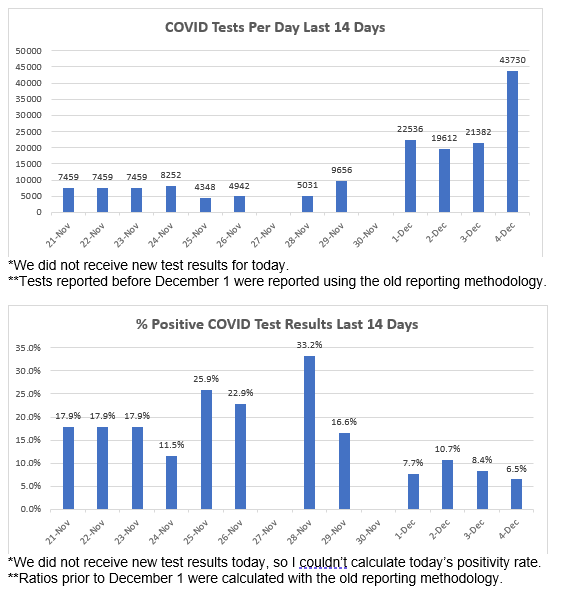
Total Tests: For some reason, OHA is not reporting test results today, so our cumulative total of tests remains at 2,087,054.
-
Positivity Rate: Without test results for today, I can’t calculate the positivity rate. The national ratio today is 9.7%.
-
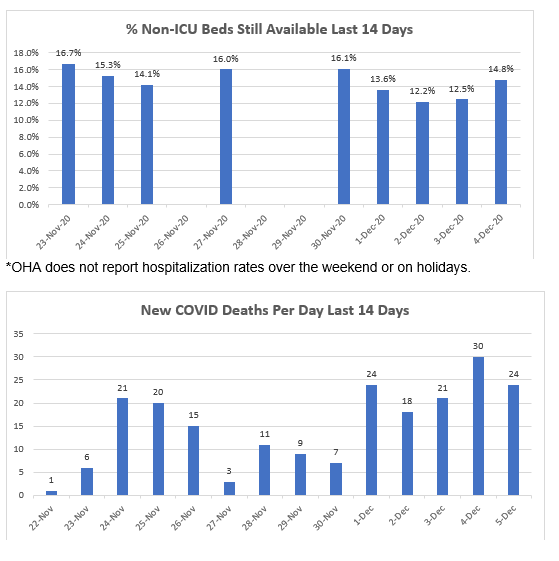
Deaths: I’m sorry to have to report 24 additional COVID deaths today. You can read about the Oregonians we lost further down in the newsletter. The total number of COVID deaths in Oregon is now 1,027.
-
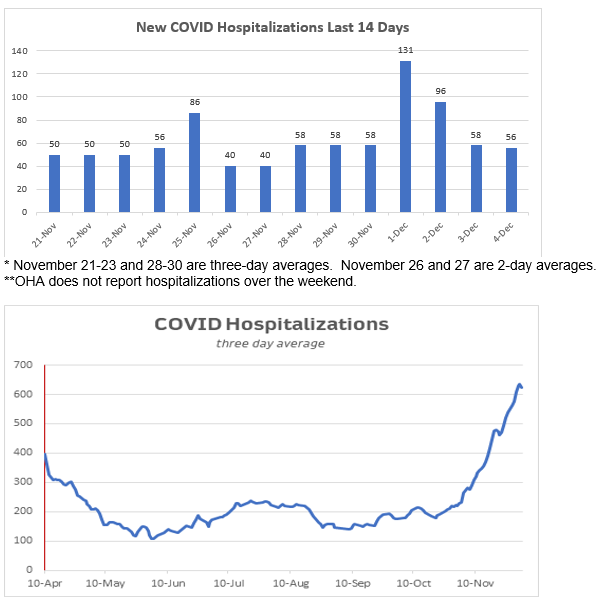
Hospitalized: OHA does not report on hospitalizations over the weekend. The cumulative number of those who have been hospitalized with COVID thus remains at 4,859.
-
Presumptive Cases: OHA is including “presumptive COVID-19 cases” in its reports, consistent with recently amended guidance from the Centers for Disease Control and Prevention. A presumptive case is someone who does not yet have a positive PCR test but is showing symptoms and has had close contact with a confirmed case. If they later test positive by PCR, those will be recategorized as confirmed cases.
-
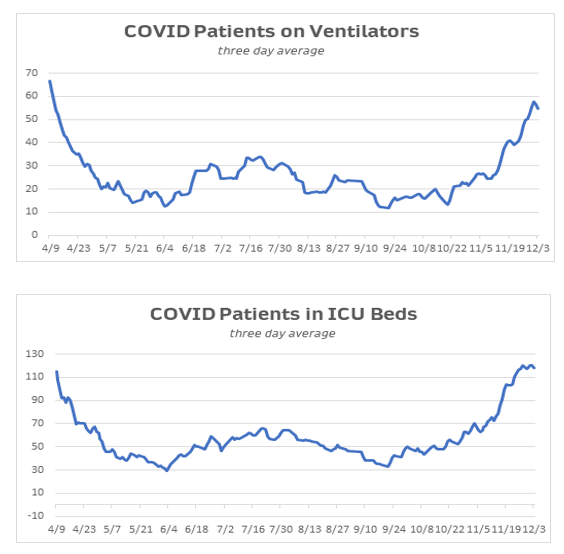
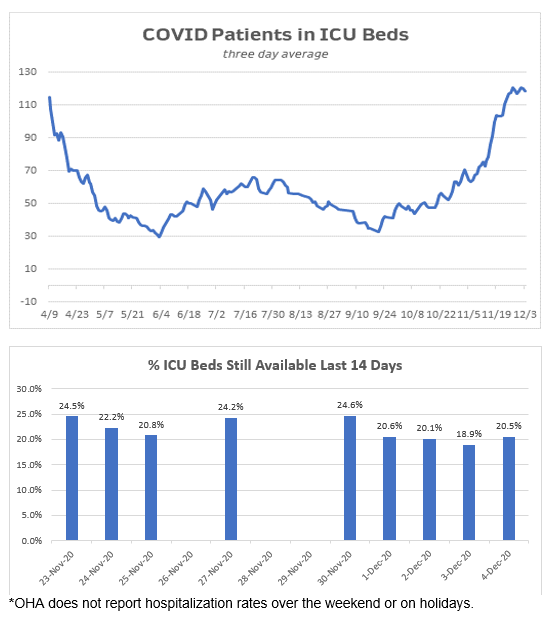
Other Hospital Information: OHA DOES NOT REPORT hospitalization information over the weekend, so the numbers below are the same as Friday’s.
- Patients Currently with COVID-19 Symptoms (who may or may not have received a positive test result yet): 596 (33 fewer than yesterday). Of those, 557 (2 fewer than yesterday) have already received a positive test back.
- Available ICU Beds: 146 (13 more than yesterday)
- Other Available Beds: 661 (102 more than yesterday).
- ICU Patients w COVID-19 Symptoms: 127 (5 more than yesterday).
- COVID-19 Patients Currently on Ventilators: 59 (7 more than yesterday).
- Available Ventilators: 745 (16 more than yesterday).
-
Dashboards:
-
Today’s National Numbers:
- Total Tests: 202,429,337 (up 2,169,756 from yesterday).
- Total Cases: 14,146,191 14,357,264 (up 211,073 from yesterday.)
- Deaths: 272,236 (up 2,445 from yesterday).
- These national numbers come from the COVID Tracking Project. You can follow them here.
-
Additional Brief Updates:
- Over the last nine months scientists have come to a better understanding of different aspects of COVID-19, though much misinformation remains out there. Today’s Washington Post includes an article discussing 8 facts that we do know about the disease.
What’s Going On In the Counties?
Each Saturday I’m tracking how individual counties are doing. The key metrics that OHA is watching are the number of cases per 100K residents and the percentage of positive test results among all tests administered. (They also are looking at hospital capacity and changes in hospitalization rates, but I don’t have that information by county.)
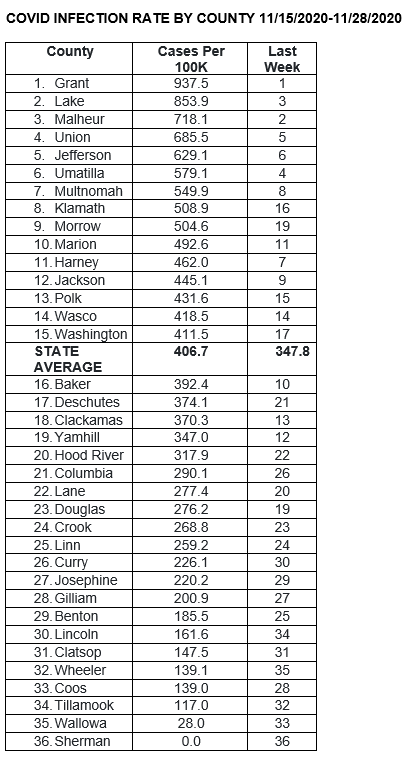
The first chart below gives us the number of cases per 100K residents, with the counties ranked from most to least infections. It comes from the weekly school metrics report, which is used to determine when it’s safe for schools in that area to reopen. This per-100K view is useful because it allows us to see the case rate within each county, irrespective of their total populations. If you look at the counties at the top of the chart, you’ll see the impact that even a small outbreak can have on a county with a very small population.
In the past, this chart showed the cumulative infection rates since the beginning of the pandemic, which is less useful if you want to know what’s happening in the county right now. This chart shows the rate for the two weeks prior to November 28. You’ll also be able to compare each county’s most recent rank with its previous rank.
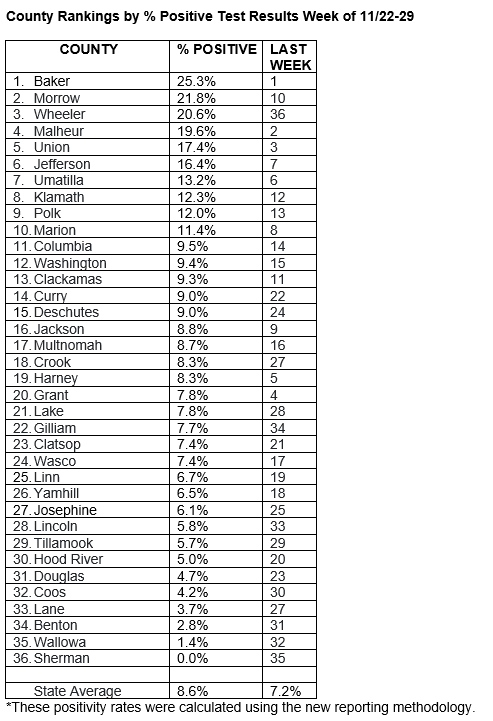
 Below is a table I’ve created that shows county rankings by the most recent week’s positivity rate. It uses OHA’s new test reporting methodology (reporting the total number of tests given, not the individual test-takers). The new methodology is more in line with the norm around the country. It increases the number of total tests reported without changing the number of positives reported. As a result, the positivity rate is much lower this way for most counties. You can also see the effect of multiple testing of students in Benton and Lane Counties, home to OSU and UO respectively—they are now among the counties with the lowest positivity rates.
If you’d like to see a chart containing the positive test results, total test results, and positivity rates for the counties over the last month, you’ll find it here.
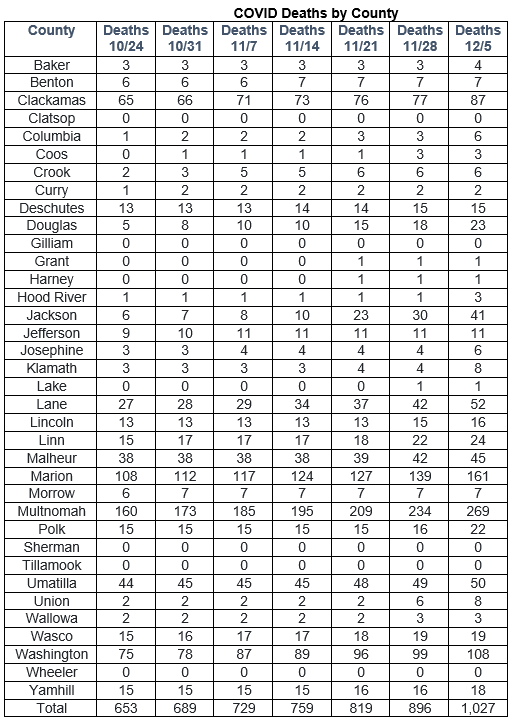
 And finally, here is a chart showing the number of deaths for each county, as of today. Sadly, we can see the inevitable result of the surge in cases that began a month ago and the increase in severe hospital cases that we’ve seen over the last few weeks.
 Disease Model Update: It Gets Worse
OHA has released the latest COVID Model Update from the Institute for Disease Modeling. It’s based on case, hospitalization, and death data through November 19.
It reflects the big increases that we’ve been experiencing over the last few weeks. Their prognosis has become much more cautious in its assumptions (now more cautious than other modelers) and much less optimistic overall.
Based on the data seen up to November 19, the modelers believe that the “Re” (Effective Reproduction Number, the number of secondary cases generated by a single case) in Oregon was approximately 1.25 on November 19. That’s actually a reduction from earlier transmission rates. (At the end of October our rate was around 1.50.) If the Re level continues at the 1.25 level, we will continue to see increases in cases here in Oregon; if it appears that after November 19 we’ve returned to the level of the end of October (which seems likely, given the Thanksgiving holiday), we’ll be looking at very large increases.
The report includes a number of graphs and discussion of assumptions and methodology that I invite you to check out. Looking forward, it provides us with two possible scenarios for what we can expect between now and Christmas.
Scenario 1: Transmission Continues As Is:
If we continue as we are now (with an Re of 1.25), between December 11 and December 24, the projected number of new diagnosed cases will reach 660 per 100,000 people for the state as a whole. (It’s currently 406). This rate translates to a daily average of 2,000 new diagnosed cases. New severe cases (i.e., those requiring hospitalization) would increase to 75 per day by December 24.
Scenario 2: Transmission Returns to End-of-October Level:
This scenario assumes that we will see an increase in transmission around Thanksgiving to the same level as late-October (Re = 1.50) and that transmission level is maintained: New diagnosed cases will increase to 920 per 100,000 people for the two-week period between December 11 and December 24, an average of 2,700 new diagnosed cases per day. New severe cases will increase to 110 per day by December 24.
As you can see, there’s no scenario now that assumes that we can expect a lowering of our transmission rate between now and the rollout of the vaccines. Our goal now is to curb the increase as much as possible.
In the words of the modelers, These results highlight how the level of COVID-19 activity depends strongly on the collective success of mitigation efforts in the coming months.
Latest OHA Weekly COVID Report Released
OHA released its WEEKLY COVID REPORT on Wednesday. It is again a very comprehensive snapshot of different aspects of transmission of the disease in Oregon over the past week or so. It confirms what we’ve been seeing in our daily reports: we are seeing record rates of transmission in Oregon, accompanied by low testing rates and increases in test positivity, hospitalizations, and deaths. It continues to show ongoing disproportionality among racial and ethnic groups.
Here are some of OHA’s broad observations of where we are now, based on data from November 23-November 28:
Nine hundred twelve of the 75,433 cases reported to date in Oregon have died in association with COVID-19—a case-fatality rate of 1.2%.
- We see once again a big increase in the number of new cases. Last week OHA reported a new record 9,100 new cases of COVID-19 infection, a 5% increase from the previous week’s 8,687. This is the sixth consecutive week of new record highs. A silver lining, though, is that the 5% rate of increase is much less than the previous week’s 34%.
- The total number of COVID tests increased to 141,356 (up from the previous week’s 129,564).
- The positivity rate increased last week to 8.6% (up from 7.2% the previous week).
- The number of new COVID hospitalizations rose again last week, from 366 to 398, an 8% increase.. This constitutes an average of 57 new hospitalizations per day (up by 5 per day), another record high. Unfortunately, next week’s is on track to be MUCH higher.
- The number of COVID deaths increased by 86 last week, up from 61 the previous week. Sadly, our number of deaths has already increased by 124 in the six days since last week’s reporting period ended.
- OHA reports a cumulative death count of 912 (up from 826) on November 29. This again constitutes a mortality rate of 1.2% of reported cases.
The report again provides information about signs, symptoms, and risk factors; racial/ethnic/age/gender demographics; and recovery rates.
It now includes the state’s positivity rates for each week since the pandemic began, using the new reporting method. It also includes case numbers and positivity rates for each county over the last month.
It no longer includes information on outbreaks. That information is now included in a separate Outbreak Report, which also includes the zip code data. I’ll provide a summary of that report in tomorrow’s newsletter.
Racial/Ethnic
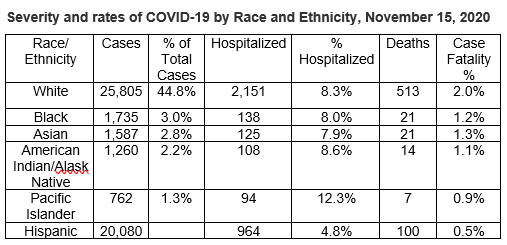
The report again demonstrates significant disparities among racial groups. You can see this in the charts below, with data that I’ve taken from the November18 report, the November 25 report, and from this report. It allows you to see at a glance the proportion of case counts within different racial groups and ethnic groups (technically, “Hispanic” is not a race and is counted as an ethnic group, with numbers from a separate chart).
To help you understand the racial/ethnic data reported in the weekly report, I’ve also created a chart that shows the hospitalization and death rates per 100K population, along with the infection rates per-100K population for each racial/ethnic group.
You’ll see again how much higher the case rates per 100,000 are for most racial/ethnic groups compared to White Oregonians. Black Oregonians are 2.75 times more likely to contract the disease than are White Oregonians, Native Americans 3.25 times more likely, Latinx Oregonians are 4.6 times more likely, and Pacific Islanders are now 5.5 times more likely. The differences, while still large, have continued to go down slightly from week to week. The differential rate for Pacific Islanders, while very large, is half what it was during the summer.
You’ll also again see that hospitalization rates among those who have contracted the disease are quite a bit lower for Latinx, and somewhat higher for Pacific Islanders than for the population of White Oregonians. Among those who have contracted the disease, the percentage who ultimately die of it is higher for Whites than for people of color.
However, you’ll also see in the final chart that when examined as a proportion of their populations in Oregon, the hospitalization and death rates for Blacks, Native Americans, Latinx, and especially Pacific-Islander Oregonians continue to be disproportionally high. (The hospitalization rate for Pacific Islanders is more than 8 times the rate for Whites.) It helps us to see why it’s so important that special outreach needs to be made to members of these racial/ethnic groups.
 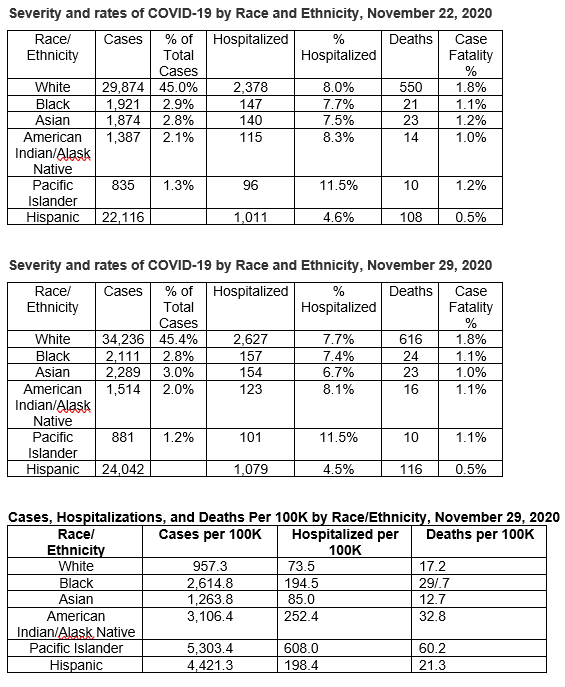 The weekly report also includes graphs showing how Public Health agencies are doing in contact tracing for different racial and ethnic groups. For the most part, the rate of follow-up interviews with Oregonians of color appears to be comparable to the rate with White Oregonians (actually, higher among Latinx Oregonians). Those attempts are less successful for Black Oregonians.
Where Are Today’s New Cases?
If we put together the positive test results and new “presumptive” cases reported today, the overall number of new cases reported for is 1,847. Here is the breakdown of reported cases by county for today:
Baker (9)
Benton (21)
Clackamas (80)
Clatsop (7)
Columbia (25)
Coos (18)
Crook (14)
Curry (1)
Deschutes (78)
Douglas (23)
Harney (2)
Hood River (14)
Jackson (86)
Jefferson (20)
Josephine (34)
Klamath (84)
Lake (4)
Lane (135)
Lincoln (11)
Linn (62)
Malheur (43)
Marion (193)
Morrow (8)
Multnomah (400)
Polk (33)
Tillamook (6)
Umatilla (47)
Union (11)
Wasco (27)
Washington (312)
Wheeler (1)
Yamhill (38)
And the Deaths
Oregon’s 1004th COVID-19 death is a 77-year-old man in Clackamas County who tested positive on Nov.17 and died on Nov. 25, at his residence.
Oregon’s 1005th COVID-19 death is a 78-year-old man in Yamhill County who tested positive on Nov. 13 and died on Nov. 20, at Willamette Valley Medical Center.
Oregon’s 1006th COVID-19 death is a 93-year-old woman in Clackamas County who tested positive on Nov. 12 and died on Nov. 22, at his residence.
Oregon’s 1007th COVID-19 death is a 71-year-old man in Multnomah County who tested positive on Nov. 7 and died on Nov. 18, at Legacy Emanuel Medical Center.
Oregon’s 1008th COVID-19 death is an 87-year-old man in Douglas County who tested positive on Nov. 1 and died on Nov. 23, at his residence.
Oregon’s 1009th COVID-19 death is a 63-year-old woman in Douglas County who tested positive on Nov. 21 and died on Dec.4, at Mercy Medical Center.
Oregon’s 1010th COVID-19 death is a 59-year-old man in Multnomah County who tested positive on Oct. 20 and died on Dec. 3, at Legacy Mt. Hood Medical Center.
Oregon’s 1011th COVID-19 death is a 76-year-old woman in Multnomah County who tested positive on Nov. 13 and died on Dec. 3, at Legacy Mt. Hood Medical Center.
Oregon’s 1012th COVID-19 death is a 67-year-old woman in Multnomah County who tested positive on Nov.18 and died on Dec.3, at Legacy Mt. Hood Medical Center. S
Oregon’s 1013th COVID-19 death is a 95-year-old woman in Marion County who tested positive on Sept. 22 and died on Nov 3, at her residence.
Oregon’s 1014th COVID-19 death is a 76-year-old man in Douglas County who tested positive on Nov.16 and died on Dec. 3, at his residence.
Oregon’s 1015th COVID-19 death is a 78-year-old woman in Clackamas County who tested positive on Nov. 13 and died on Nov. 26.
Oregon’s 1016th COVID-19 death is an 81-year-old man in Clackamas County who tested positive on Nov. 16 and died on Dec. 1, at his residence.
Oregon’s 1017th COVID-19 death is an 80-year-old man in Multnomah County who tested positive on Nov.16 and died on Dec. 3, at Legacy Emanuel Medical Center.
Oregon’s 1018th COVID-19 death is a 77-year-old woman in Multnomah County who tested positive on Nov.17 and died on Nov.22, at Adventist Medical Center.
Oregon’s 1019th COVID-19 death is an 83-year-old man in Washington County who tested positive on Nov.23 and died on Dec. 1, at Providence St. Vincent Medical Center.
Oregon’s 1020th COVID-19 death is a 94-year-old male in Polk County who tested positive on Nov. 23 and died on Dec. 1, at his residence.
Oregon’s 1021st COVID-19 death is an 82-year-old female in Klamath County who tested positive on Nov.27 and died on Dec. 1, at her residence.
Oregon’s 1022nd COVID-19 death is a 91-year-old female in Marion County who tested positive on Nov. 28 and died on Dec. 2, at Legacy Meridian Park Medical Center.
Oregon’s 1023rd COVID-19 death is a 92-year-old man in Marion County who tested positive on Nov. 30 and died on Dec. 4, at Legacy Meridian Park Medical Center.
Oregon’s 1024th COVID-19 death is a 68-year-old woman in Columbia County who tested positive on Nov.20 and died on Dec. 1.
Oregon’s 1025th COVID-19 death is a 71-year-old man in Josephine County who tested positive on Dec. 2 and died on Dec. 3, at Three Rivers Medical Center.
Oregon’s 1026th COVID-19 death is a 94-year-old woman in Polk County who tested positive on Oct.27 and died on Dec. 2, at Salem Hospital.
Oregon’s 1027th COVID-19 death is a 97-year-old man in Columbia County who tested positive on Nov. 22 and died on Nov.27.
Additional Graphs:
      **You can find a breakdown of regional availability here.
 Want to See Past Newsletters?
If there was COVID-related information in a past newsletter that you want to go back to, but find you’ve deleted it, you can always go to my legislative website (senatordembrow.com), click on “News and Information,” and you’ll find them all there. Also, if someone forwarded you this newsletter and you’d like to get it directly, you can sign up for it there.
AND FINALLY,
Here again are some resources that you will find useful:
If the above links are not providing you with answers to your questions or directing you to the help that you need, please consider me and my office to be a resource. We’ll do our best to assist you or steer you in the right direction.
Best,
 Senator Michael Dembrow
District 23
email: Sen.MichaelDembrow@oregonlegislature.gov
web: www.senatordembrow.com
phone: 503-986-1723
mail: 900 Court St NE, S-407, Salem, OR, 97301
|