|
November 21, 2020
I hope that you and your loved ones are doing well, staying healthy, and looking out for your neighbors and friends in these difficult times.
Since it’s Saturday, you’ll find only partial reporting on some of the metrics tracking coronavirus in Oregon. Instead of giving us the positive test results alone, over the weekend OHA combines those numbers with the relatively small number of those who are presumed to be positive based on their symptoms and close proximity to someone who has tested positive, but whose test results have not yet come back. But it still gives us a good idea of what’s going on.
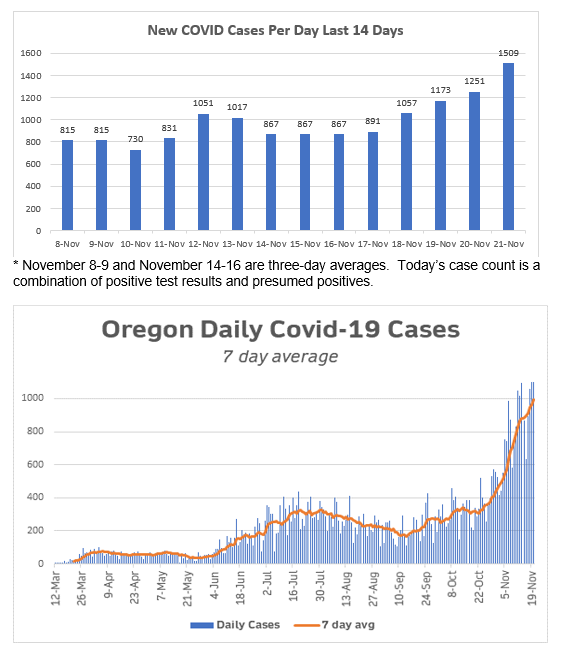
And the news again is awful. Case counts are now over 1,500, a level that the most recent modeling update suggested wouldn’t come for a couple of weeks. We’ve lost another seven Oregonians to COVID, four of them residents of Jackson County.
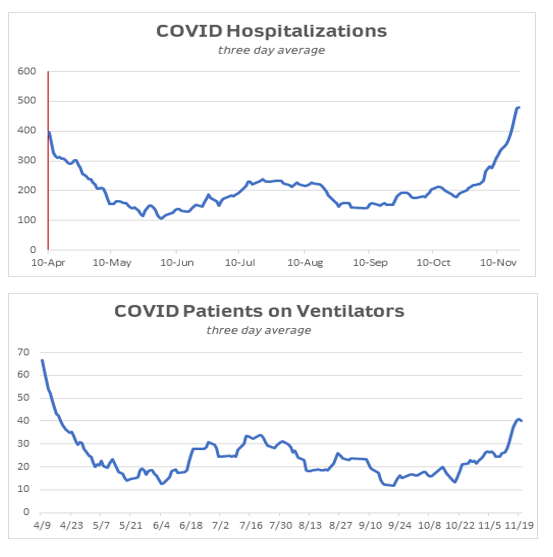
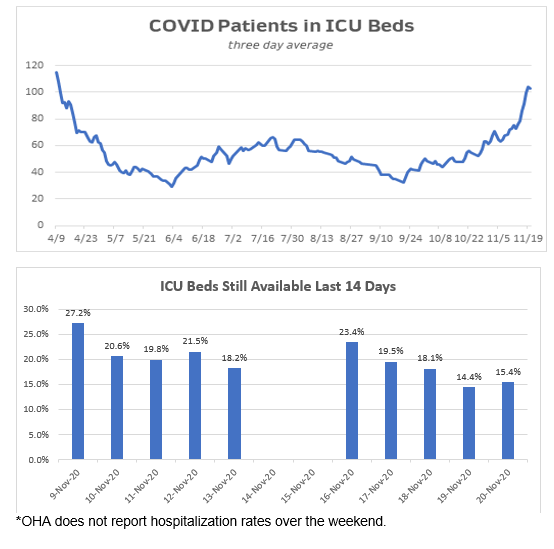
We don’t get hospitalization numbers over the weekend, so we won’t know what the rate of increase is till Monday. But with these ongoing high case counts, it’s likely that the number of severe infections is also rising and the number of available beds reducing, as we’ve been seeing over the past weeks.
As I’ve been doing on Saturdays for a while, I’m also taking the opportunity to look back at what’s going on in our individual counties on a week-by-week basis over the last month. It allows us to see the trends in the individual counties, as well as the trends for the state as a whole. We can see that counties and the state as a whole are seeing record levels of new cases and positivity rates are again reaching record levels.
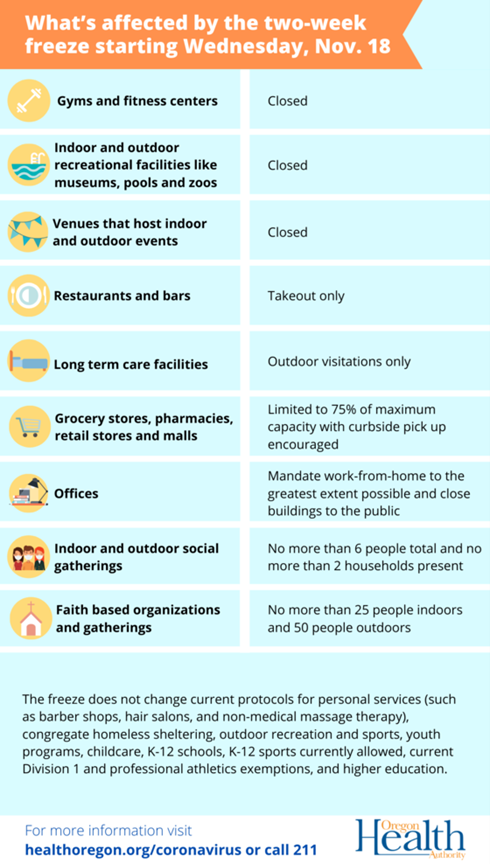
Meanwhile, the effort to curb the virus by asking people to work from home where possible and restricting indoor dining and drinking, indoor gyms, large gatherings, and other situations that the health authorities have told us are dangerous is getting a fair amount of pushback from affected industries and rural elected officials. You can read more about that in some of the articles that are provided below.
For the record, I respect the advice of the Governor’s medical advisory team in this effort to bring down case numbers. We’ve always known that a fall wave of the disease was possible, that we needed to be ready for it, and that it might be much more harmful than was the initial wave in the spring and summer. That’s what we’re seeing play out right now. We were able to flatten the growth of the disease back in the spring; with concerted effort we should be able to do it again. That’s going to be especially important—and difficult--during the upcoming holiday season.
Hopefully, Congress will come through with another aid package that will help relieve the burden on our businesses that are taking the brunt of these restrictions. That will definitely help. In the meantime, please find a way to frequent your local businesses however you can.
Please stay safe, and let me know if you have any questions about today’s newsletter.
TODAY’S CORONAVIRUS AND CORONAVIRUS RESPONSE UPDATE
-
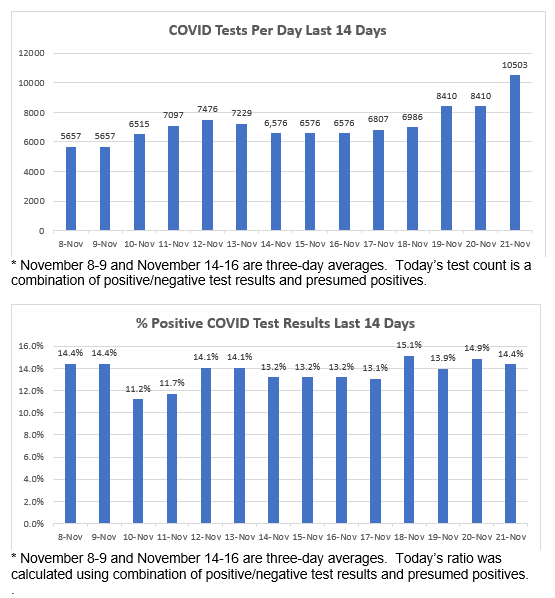
Positive Cases: OHA reports that 1,509 additional Oregonians have tested positive or are presumed positive (see below for definition) for COVID. OHA does not report positive test results alone over the weekend. I’ll be able to readjust the numbers on Monday to remove the presumed positives. The cumulative total for those testing positive and presumed positive since the beginning of the pandemic is 63,668
-
Total Tests: The number of reported tests has increased by 10,503. Today’s increase in total results also includes presumed positives in the total results, so may be a little high. I’ll readjust the numbers on Monday. The cumulative total is now 1,001,247.
-
Ratio: The percentage of total tests that have been reported positive is 14.4%. The national ratio today is 9.1%.
-
Deaths: I’m sorry to have to report 4 additional COVID deaths today. You can read about the Oregonians we lost further down in the newsletter. The total number of COVID deaths in Oregon is now 812.
-
Hospitalized: OHA does not report on hospitalizations over the weekend. The cumulative number of those who have been hospitalized with COVID thus remains at 3,970.
-
Presumptive Cases: OHA is including “presumptive COVID-19 cases” in its daily reports, consistent with recently amended guidance from the Centers for Disease Control and Prevention. A presumptive case is someone who does not yet have a positive PCR test but is showing symptoms and has had close contact with a confirmed case. If they later test positive by PCR, those will be recategorized as confirmed cases.
-
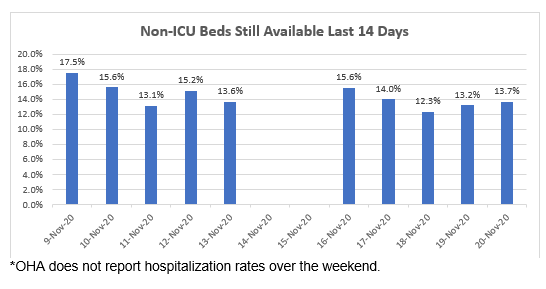
Other Hospital Information: OHA DOES NOT REPORT hospitalization information over the weekend, so the numbers below are the same as Friday’s.
- Patients Currently with COVID-19 Symptoms (who may or may not have received a positive test result yet): 458 (39 fewer than yesterday). Of those, 412 have already received a positive test back.
- Available ICU Beds: 111 (7 more than yesterday)
- Other Available Beds: 615 (22 more than yesterday).
- ICU Patients w COVID-19 Symptoms: 99 (8 fewer than yesterday).
- COVID-19 Patients Currently on Ventilators: 38 (3 fewer than yesterday).
- Available Ventilators: 746 (13 more than yesterday).
-
Dashboard:
-
Today’s National Numbers:
-
Additional Brief Updates:
- As you can imagine, legislators are hearing from many people critical of the recent “freeze” restrictions ordered by the Governor. Nearly all of those that I’m receiving are coming from the rural parts of the state. Ironically, those are among the areas that are seeing the most explosive provides a survey of county reactions in today’s paper.
- Without a doubt COVID has damaged employment in a number of job sectors, whether or not restrictions are in place. Many of those jobs will return once the pandemic has been curtailed and people feel they can safely go back to the world at the start of 2020. An article in today’s Statesman-Journal looks at ten occupations that may not be coming back because they were already seeing job openings going down before the pandemic because of automation, e-commerce, and other larger trends.
- The Statesman-Journal published an article from USA Today showing the many parallels between our current dilemma over how to celebrate the holidays in the midst of a pandemic and the very similar situation that the nation found itself in during the Spanish Flu pandemic of 1918. It’s quite interesting.
What’s Going On In the Counties?
Each Saturday I’m tracking how individual counties are doing, especially now that we’re seeing big increases in cases around the state. The key metrics that OHA is watching are the number of positive test results (per 100K residents) and the percentage of positive test results among all tests administered; the latter will be the more important way for us to see if the infection rate is increasing as a result of reopening and increased testing. (They also are looking at hospital capacity and changes in hospitalization rates, but I don’t have that information by county.)
But first, I want to reproduce the current INTERACTIVE COUNTY DASHBOARD that the OHA has on its website. It shows case counts and total testing by county since the pandemic, scaled to cases per 100,000, so that we can see how the infection is penetrating the various counties, irrespective of their population size. This is what we see as of November 20:
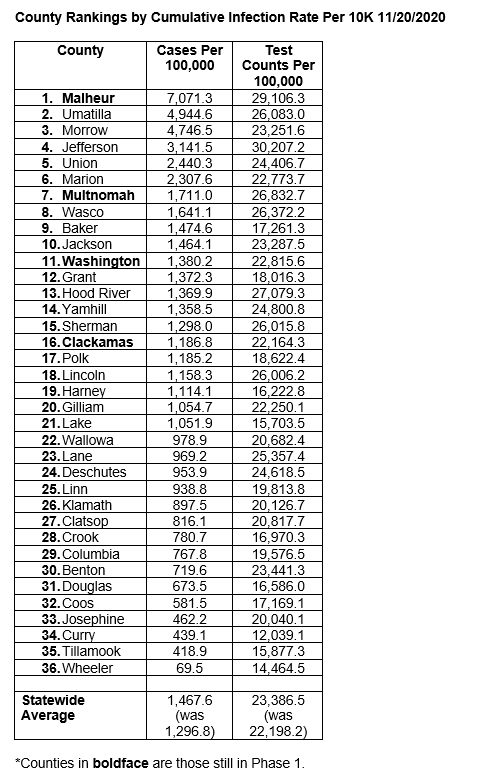
This is a useful view because it allows us to see the infection rate within each county, irrespective of their total populations. Remember, though, that these are CUMULATIVE cases since the beginning of the pandemic. If you look at the rankings, you can see the lingering effects of outbreaks at workplaces and other congregate settings that occurred months ago. It also means that more recent outbreaks may not lead to big changes in the above rankings. However, with the recent surge leading to sharp spikes in a few small counties, this time we do see some big jumps in rankings. (Grant County is a notable example.)
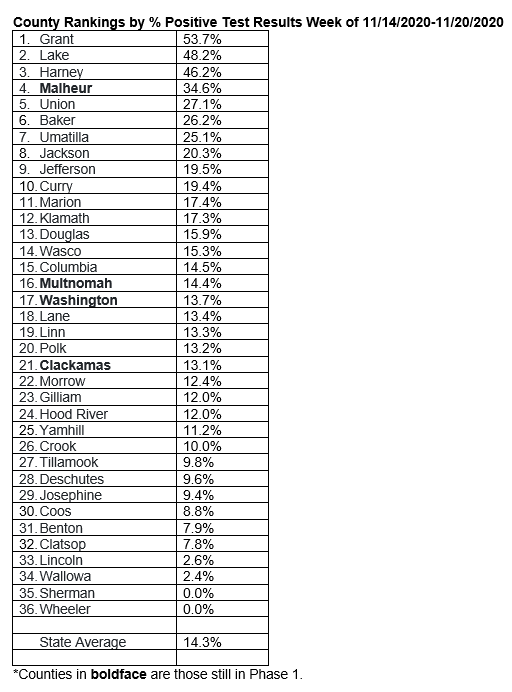
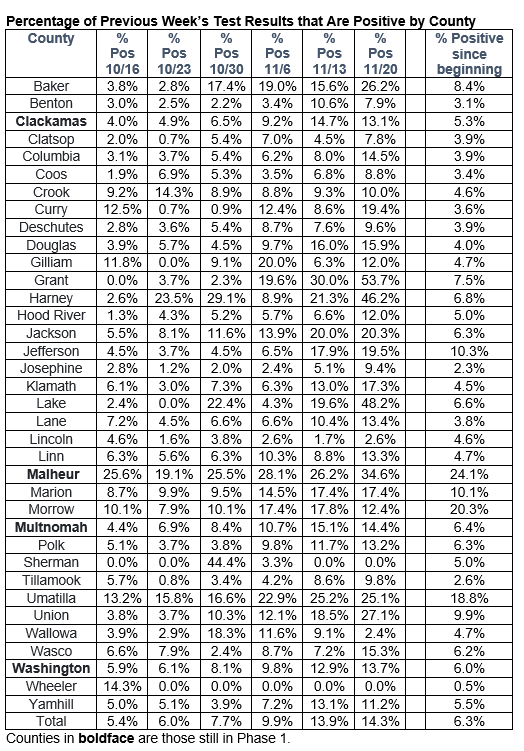
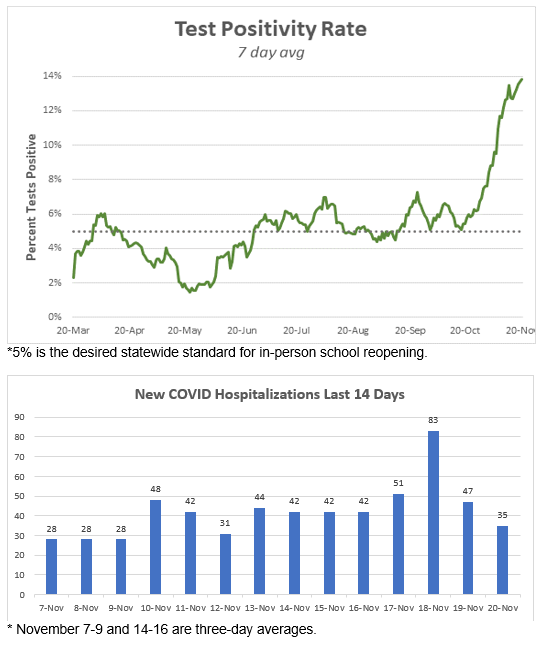
While the cumulative infection rate is an important metric to look at, I believe an even more important metric is the rate of test results coming in positive. The more you test, the lower that number should be, as you’re not just testing people with clear symptoms of COVID. Our school reopening target is 5%. Anything over 10% is cause for real concern. This week our state average is well over that level, and nearly three-fourths of the counties are over 10% this week.
Here’s a table I’ve created that shows county rankings by the most recent week’s positivity rate. When you compare it to the previous table. you get a better sense of what’s happening in the individual counties from week to week. You’ll see that the biggest positivity rates are in our rural counties. In part that’s because a relatively small number of new cases can make a big difference; in part it’s because COVID is increasingly showing up in those counties.
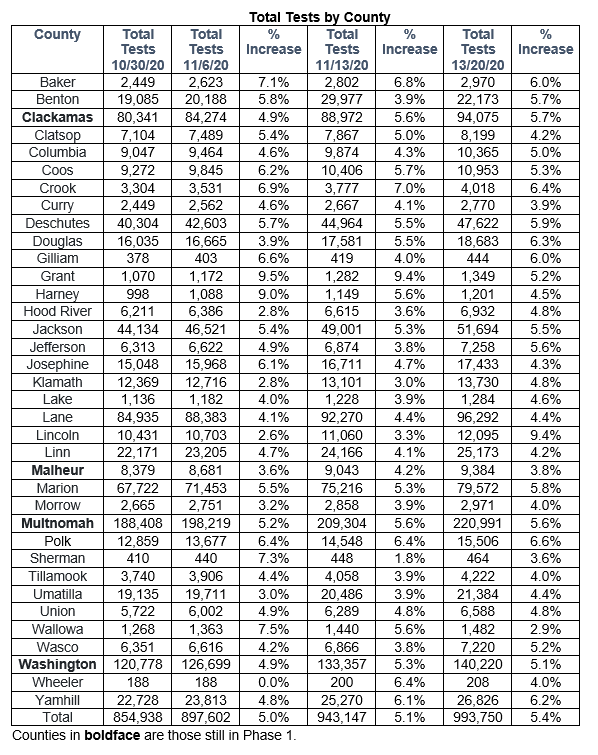
 Looking at the tables below, showing the new cases, new tests, positivity rates, and deaths in the different counties, we can see what’s been going on over the last week. You’ll see the effects of the ongoing record number of new cases, which are unfortunately outpacing the number of new tests. As a result, you’ll see a return to high positivity rates for individual counties and for the state as a whole. Oregon’s statewide positivity rate for the week is barely below that 10% danger zone.
As I mentioned in yesterday’s newsletter, the state is changing its test reporting reporting methodology to bring it more in line with the norm around the country. This will result in an increase in the number of tests and a consequent reduction in the positivity rate. That change is not yet reflected in this week’s analysis.
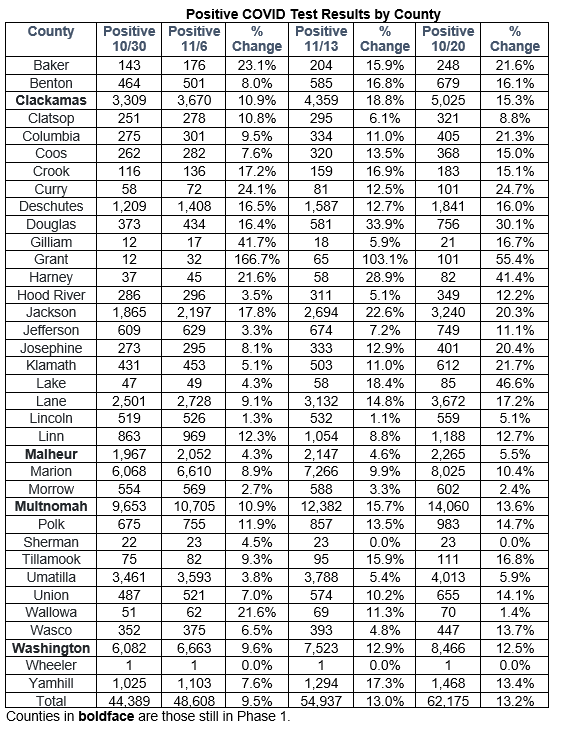  In order to make the current trends in positive percentages more obvious, I’m again showing you the week-over-week percentages, along with the overall percentage of positive cases for each county since the beginning of the pandemic.
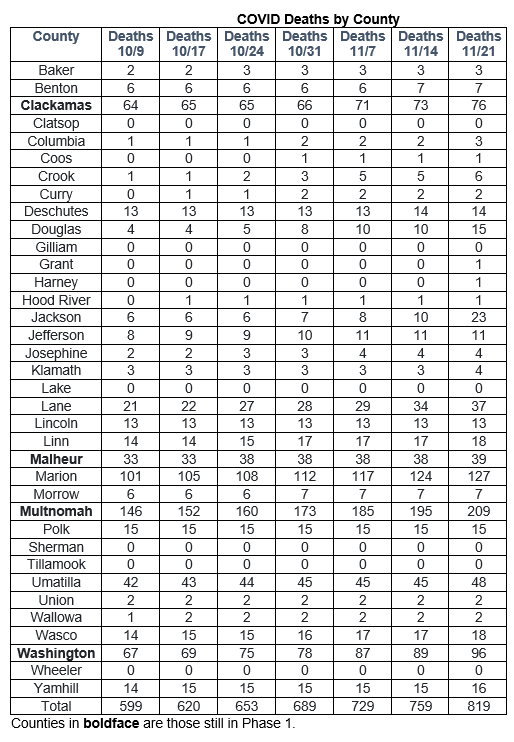
 In the following chart we can see that the current surge in cases is now resulting in a large increase in COVID deaths. We see that for the state as a whole, but Jackson County really stands out this week.
 For additional data on the counties, here is the latest County Watch List Data. It shows infections per 100K, along with the number and rate of “sporadic cases” (also known as “community spread cases”): those that cannot be traced to a particular source.
If you’re interested in seeing an even more granular picture of what’s happening on the ground, cumulatively and over the last week, The Oregonian has created an interactive map of cases by zip code.
Where Are Today’s New Cases?
If we put together the positive test results and new “presumptive” cases reported today, the overall number of new cases for today is 1,509. Half of today’s new cases are from the Portland Tri-County area, with record numbers from Multnomah County. Here is the breakdown by county for today:
Baker (9)
Benton (22)
Clackamas (122)
Clatsop (5)
Columbia (10)
Coos (6)
Crook (3)
Curry (4)
Deschutes (35)
Douglas (37)
Grant (11))
Harney (3)
Hood River (6)
Jackson (63)
Jefferson (8)
Josephine (16)
Klamath (20)
Lake (7)
Lane (87)
Lincoln (4)
Linn (45)
Malheur (27)
Marion (124)
Morrow (10)
Multnomah (414)
Polk (42)
Umatilla (40)
Union (31)
Wasco (14)
Washington (223)
Wheeler (1)
Yamhill (60)
And the Deaths
Oregon’s 813th COVID-19 death is a 76-year-old man in Douglas County who tested positive on Oct. 29 and died on Nov. 19, at Mercy Medical Center.
Oregon’s 814th COVID-19 death is an 84-year-old man in Jackson County who tested positive on Oct. 24 and died on Nov. 13. Location of death is being confirmed.
Oregon’s 815th COVID-19 death is a 75-year-old woman in Columbia County who tested positive on Oct. 23 and died on Nov. 19, at Legacy Emanuel Medical Center.
Oregon’s 816th COVID-19 death is a 77-year-old woman in Jackson County who tested positive on Nov. 9 and died on Nov. 19, at her residence.
Oregon’s 817th COVID-19 death is an 83-year-old man in Jackson County who tested positive on Nov. 10 and died on Nov. 20, at his residence.
Oregon’s 818th COVID-19 death is an 86-year-old man in Washington County who tested positive on Nov. 2 and died on Nov. 19, at his residence.
Oregon’s 819th COVID-19 death is an 85-year-old woman in Jackson County who tested positive on Nov. 12 and died on Nov. 20, at her residence.
Additional Graphs:
     **You can find a breakdown of regional availability here.
 Want to See Past Newsletters?
If there was COVID-related information in a past newsletter that you want to go back to, but find you’ve deleted it, you can always go to my legislative website (senatordembrow.com), click on “News and Information,” and you’ll find them all there. Also, if someone forwarded you this newsletter and you’d like to get it directly, you can sign up for it there.
AND FINALLY,
Here again are some resources that you will find useful:
If the above links are not providing you with answers to your questions or directing you to the help that you need, please consider me and my office to be a resource. We’ll do our best to assist you or steer you in the right direction.
Best,
 Senator Michael Dembrow
District 23
email: Sen.MichaelDembrow@oregonlegislature.gov
web: www.senatordembrow.com
phone: 503-986-1723
mail: 900 Court St NE, S-407, Salem, OR, 97301
|