|
November 15, 2020
I hope that you and your loved ones are doing well, staying healthy, and looking out for your neighbors and friends in these difficult times.
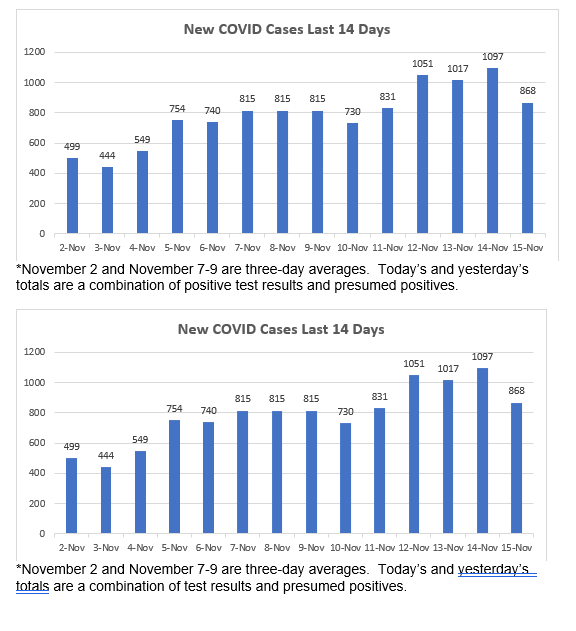
Since it’s Sunday, you’ll find only partial reporting on some of the metrics tracking coronavirus in Oregon. Instead of giving us the positive test results alone, over the weekend OHA combines those numbers with the relatively small number of those who are presumed to be positive based on their symptoms and close proximity to someone who has tested positive, but whose test results have not yet come back. But it still gives us a good idea of what’s going on.
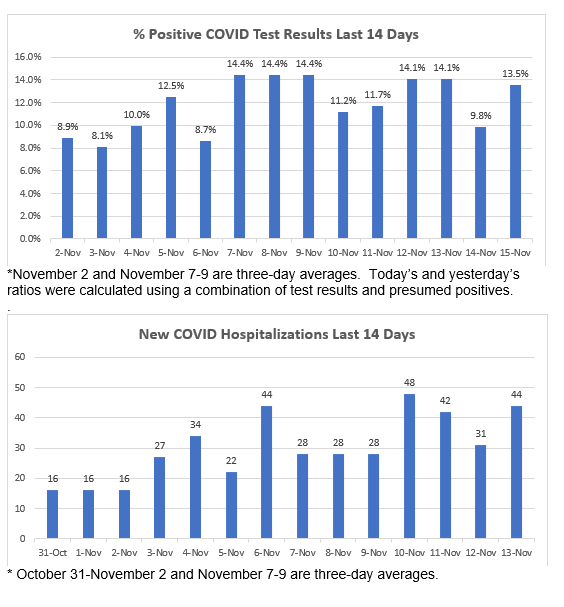
Today’s reported case numbers are down a little today, but they are still at a level that would have been unthinkable just a couple of weeks ago. More troubling is that these very high numbers cannot be attributed to more testing, as our testing numbers are nearly half of yesterday’s. Today’s positivity rate—13.5%--is back up in the danger zone.
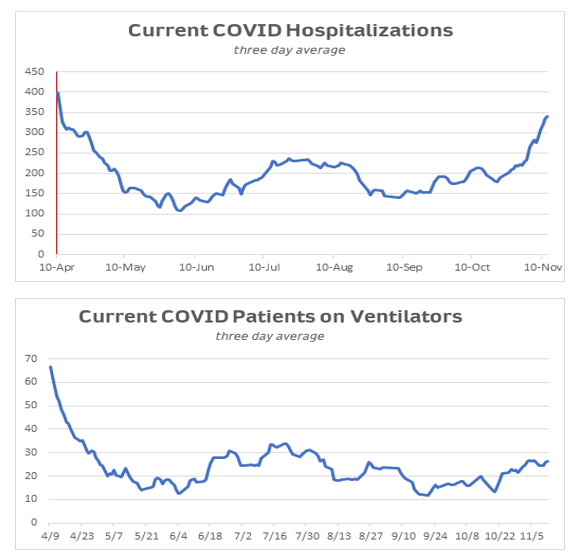
We don’t get hospitalization numbers over the weekend, so we won’t know what the rate of increase is till tomorrow. Deaths are reported, and there’s a glimmer of good news there--the number of newly-reported deaths has declined to 2 today. As I’ve pointed out before, however, it’s not unusual to see lower deaths reported on Sunday; we see the same phenomenon on the national level today.
I’m also including a summary and analysis of the most recent COVID Weekly Report. Not surprisingly, it shows record levels on a number of indicators.
In tomorrow’s newsletter I’ll include a presentation of the latest modeling information from the Institute of Disease Management. It shows that our rate of transmission has jumped to nearly 1.5, meaning that COVID will continue to spread in Oregon if we’re not able to limit the opportunities for spread: in social gatherings, at the workplace, or other indoor places where unmasked individuals are spreading it unawares.
Let’s do what we can to limit those activities where we can, in order to make a difference. The epidemiologists make it clear that very effort will help.
As I’ve been doing on Sundays, I’m also providing updated information about how COVID is affecting people of different ages. We see the same trends as in past weeks: COVID cases are most prevalent in younger people, but they tend to be less likely to be hospitalized or die from the disease. When it’s passed on to older people, however, COVID becomes much more dangerous.
Please let me know if you have any questions about today’s newsletter.
TODAY’S CORONAVIRUS AND CORONAVIRUS RESPONSE UPDATE
-
Positive Cases: OHA reports that 868 additional Oregonians have tested positive or are presumed positive (see below for definition) for COVID. OHA does not report positive test results alone over the weekend. I’ll be able to readjust the numbers on Monday to remove the presumed positives. The cumulative total for those testing positive and presumed positive since the beginning of the pandemic is 56,880.
-
Total Tests: The number of reported tests has increased by 6,414. Today’s increase in total results also includes presumed positives in the total results, so may be a little high. I’ll readjust the numbers on Monday. The cumulative total is now 957,979.
-
Ratio: The percentage of total tests that have been reported positive today is 13.5%. The national ratio today is 9.5%.
-
Deaths: I’m sorry to have to report 2 additional COVID deaths today. You can read about the Oregonians we lost further down in the newsletter. The total number of COVID deaths in Oregon is now 761.
-
Hospitalized: OHA does not report on hospitalizations over the weekend. The cumulative number of those who have been hospitalized with COVID thus remains at 3,628.
-
Presumptive Cases: OHA is including “presumptive COVID-19 cases” in its daily reports, consistent with recently amended guidance from the Centers for Disease Control and Prevention. A presumptive case is someone who does not yet have a positive PCR test but is showing symptoms and has had close contact with a confirmed case. If they later test positive by PCR, those will be recategorized as confirmed cases.
-
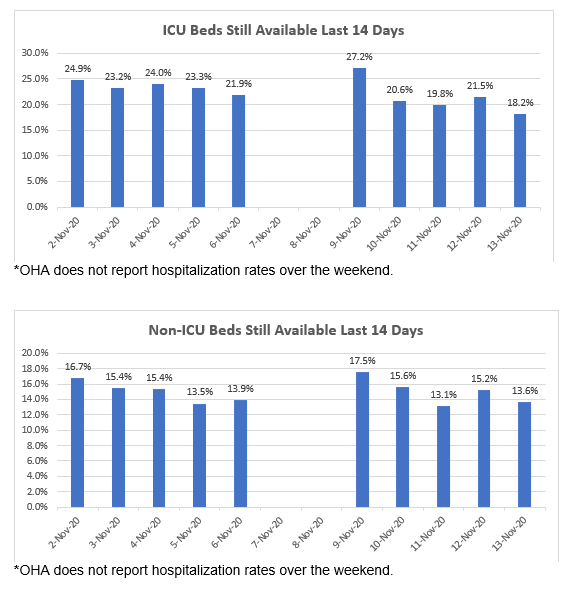
Other Hospital Information: OHA DOES NOT REPORT hospitalization information over the weekend, so the numbers below are the same as Friday’s.
- Patients Currently with COVID-19 Symptoms (who may or may not have received a positive test result yet): 356 (14 more than yesterday). Of those, 308 have already received a positive test back.
- Available ICU Beds: 131 (24 fewer than yesterday)
- Other Available Beds: 611 (69 fewer than yesterday).
- ICU Patients w COVID-19 Symptoms: 70 (3 more than yesterday).
- COVID-19 Patients Currently on Ventilators: 30 (3 more than yesterday).
- Available Ventilators: 740 (12 fewer than yesterday).
-
Dashboard:
-
Today’s National Numbers:
Additional Brief Updates:
- It’s clear to many of us that Oregon needs to be testing more widely, and that easier access to testing needs to be a crucial part of our strategy to turn back the current surge. The Oregonian’s Aimee Green does a deep dive into the problems that we’re experiencing with testing. You can read it here.
- One of the casualties of the current surge in COVID cases is the ability of public health workers to be in touch with everyone who might have had contact with an infected individual: i.e., contact tracing and counseling those in jeopardy. You can read about the problems that public health workers are experiencing in this article in today’s Oregonian.
- I regularly receive emails from individuals who are skeptical that COVID is a serious threat for a variety of reasons. They suggest that case numbers are inflated, or that deaths are falsely attributed to COVID, or that we should consider COVID no more of a threat to Oregonians than the seasonal flu. I have not seen evidence for any of these assertions. Today’s Oregonian has a useful article that focuses on the differences between COVID and the seasonal flu.
Looking at Age Metrics
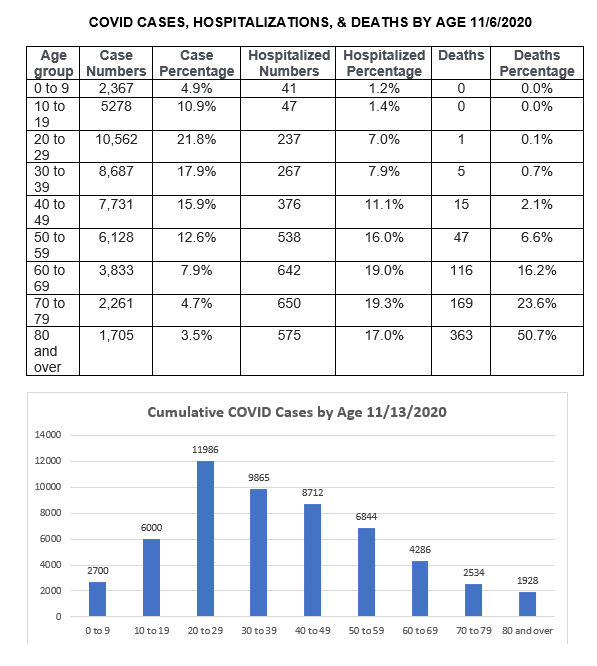
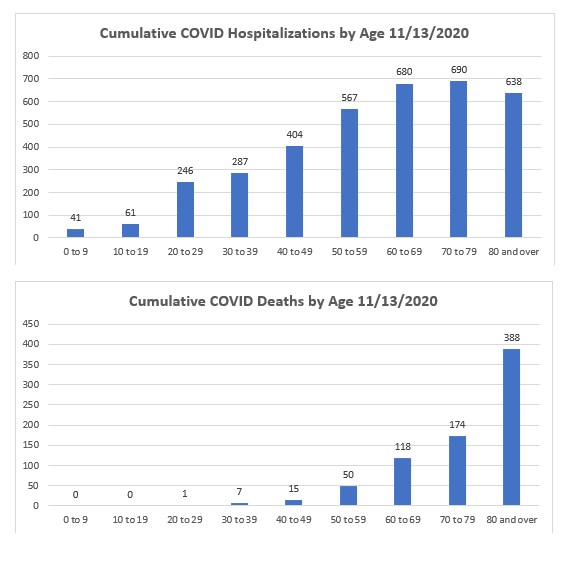
Here again are this week’s statewide case, hospitalization, and death metrics by age. Here is updated information as of November 6. The percentages for each category have again not really moved much. You’ll see again that younger people have come to dominate the category of new cases: 71% of all cases so far have been in Oregonians below younger than 50.
However, effects of the disease become much more severe when it is transmitted to older people. 71% of COVID hospitalizations are among those OVER the age of 50. Deaths remain dominated by those above the age of 70 (more than three-fourths of all deaths), though we continue to see losses among people in their 50s and younger.
Those who eventually die of the disease are increasingly to be found in the 80-and-over category. More than half of all deaths are now in this category. This may be due to improvements in COVID treatments that are making more of a difference with younger patients. However, we are starting to see more hospitalizations among people in the oldest age category, which will likely see our death rate rise further.
  Latest OHA Weekly COVID Report Released
OHA released its WEEKLY COVID REPORT yesterday. It is again a very comprehensive snapshot of different aspects of transmission of the disease in Oregon over the past week or so. It confirms what we’ve been seeing in our daily reports: we are seeing record rates of transmission in Oregon, , accompanied by low testing rates and increases in test positivity, hospitalizations, and deaths. It continues to show ongoing disproportionality among racial and ethnic groups.
Here are some of OHA’s broad observations of where we are now, based on data from November 2-November 8:
- We see once again an increase in the number of new cases. Last week OHA recorded 5,144 new cases of COVID-19 infection—up a record 46% from last week’s tally of 3,542, and nearly double the number of new cases from the previous week. This is again a new record for total weekly infections since the pandemic began.
- The number of tests reported improved again, but by a lesser amount than the previous two weeks: by 6.1% to 34,307. This is still far below where it needs to be to capture asymptomatic cases.
- The percentage of positive test results rose by more than three full percentage points to 11.9%, another record weekly high. (It is on track to be even higher next week.)
- Last week the number of newly reported deaths rose again, from 37 to 42 (another record high).
- The cumulative death rate since the beginning of the pandemic remains at 15.5 deaths per 100,000 Oregonians, with a cumulative total of 734 on November 8. This constitutes a mortality rate of 1.4% of reported cases, a slight decrease.
- The number of new COVID hospitalizations rose again last week, from 160 to 212. new COVID hospitalizations, an average of 30 new hospitalizations per day (an increase of 7 per day). This too is a new record increase.
- The age group with the highest incidence of reported infection continues to be 20–29-year-olds, with rates decreasing in subsequent decades of life.
The report again provides information about signs, symptoms, and risk factors; racial/ethnic/age/gender demographics; recovery; outbreaks in long-term care; workplace outbreaks; outbreaks in childcare centers and schools; hospital rates; and the breakdown of cases by zip code.
Racial/Ethnic
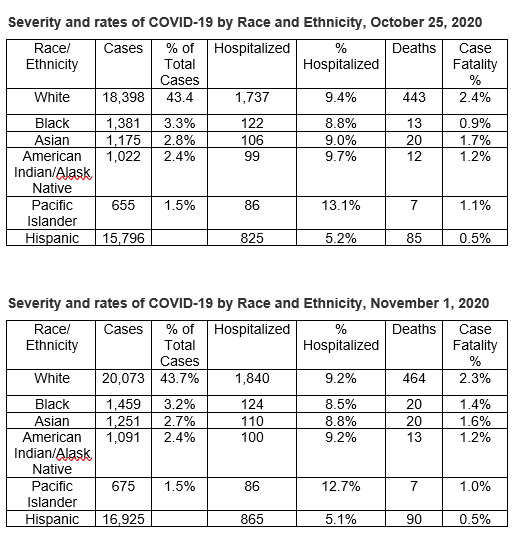
The report again demonstrates significant disparities among racial groups. You can see this in the charts below, with data that I’ve taken from the October 25 report, the November 1 report, and from this report. It allows you to see at a glance the proportion of case counts within different racial groups and ethnic groups (technically, “Hispanic” is not a race and is counted as an ethnic group, with numbers from a separate chart). They remain relatively stable.
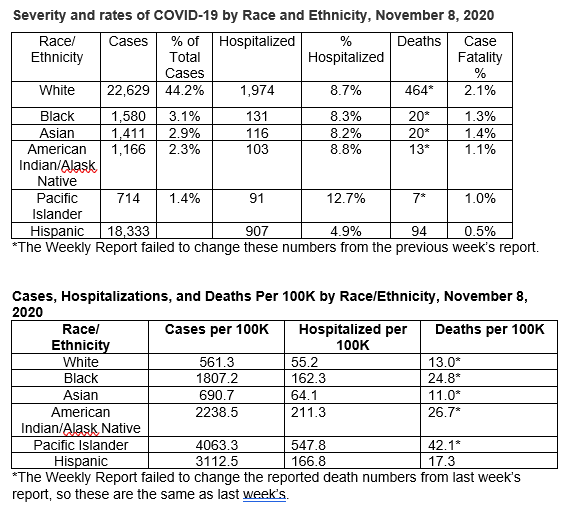
To help you understand the racial/ethnic data reported in the weekly report, I’ve also created a new chart that shows the hospitalization and death rates per 100K population, along with the infection rates per-100K population for each racial/ethnic group.
You’ll see again how much higher the case rates per 100,000 are for most racial/ethnic groups compared to White Oregonians. Black Oregonians are 3.2 times more likely to contract the disease than are White Oregonians, Native Americans 4 times more likely, Latinx Oregonians are 5.5 times more likely, and Pacific Islanders are now 7.2 times more likely. The differences, while still extremely large, have continued to go down slightly from week to week.
You’ll also again see that hospitalization rates among those who have contracted the disease are somewhat lower for Blacks and Native Americans, quite a bit lower for Latinx, and quite a bit higher for Pacific Islanders than for the population of White Oregonians. Among those who have contracted the disease, the percentage who ultimately die of it is much higher for Whites than for people of color.
However, you’ll also see in the final chart that when examined as a proportion of their populations in Oregon, the hospitalization and death rates for Blacks, Native Americans, Latinx, and especially Pacific-Islander Oregonians continue to be disproportionally high. It helps us to see why it’s so important that special outreach needs to be made to members of these racial/ethnic groups.
  The weekly report includes graphs showing how Public Health agencies are doing in contact tracing for different racial and ethnic groups. For the most part, the rate of follow-up interviews with Oregonians of color appears to be comparable to the rate with White Oregonians (actually, higher among Latinx Oregonians). Those attempts are less successful for Black Oregonians.
Outbreaks at Long-Term Care Facilities
The report lists outbreaks at long-term care facilities with more than five residents that have three or more confirmed cases or at least one COVID death.
We are now seeing increasing infections in our facilities, reflecting the increases in the general population.
This week’s report lists outbreaks in 75 (up from 71) long-term care facilities that are still considered active. They are responsible for 1019 cases (up from 805) and 58 deaths (up from 38).
Once a facility has gone 28 days without a new case, it is moved to the “Resolved” list. , There are now 159 outbreaks on the Resolved list. This is a BIG increase from last week’s 62, but there’s a good reason for that: OHA was previously dropping facilities from the resolved list after 56 days, after which there was no way for us to see in one place all the facilities that had ever experienced outbreaks.
I asked OHA to keep this information in the public eye, and they have agreed to do that. The facilities are listed in order of first date of outbreak. (I’ve asked that they be ordered alphabetically in the future for ease of access.) This list will obviously grow each week.
Facilities on the Resolved list have been responsible for 2,564 cases and 341 deaths.
In addition to the listed facilities, there are now 78 (up from 68) congregate settings with five or fewer beds that have also had three or more confirmed cases or one or more deaths. These are not listed by facility name in order to protect patient privacy.
OHA reports that in total to date, there have been 4,374 cases up from 4,200) and 424 deaths (up from 402) associated with congregate care settings. That’s again 58% of the cumulative deaths reported as of last week (a slight reduction from the previous week’.
To date, there has still been only one death of a staff member reported.
Workplace Outbreaks
Similarly, there are separate listings for workplace outbreaks that are “active” and “resolved,” but without deaths identified by workplace. Case counts include all persons linked to the outbreak, which may include household members and other close contacts. To protect privacy, OHA is only reporting workplace outbreaks with five or more cases (workers and family members) and only for workplaces with at least 30 workers. They are listed in descending order of number of cases.
You’ll find a big jump to 90 workplaces (up from 76 last week) listed as “Active” this week, totaling 2,823 cases (up from 2,597).
A facility goes onto the resolved list once it has not had a new case in 28 days.
54 workplaces (up from 55 last week) are now listed as “Resolved,” totaling 896 cases (down from 900 last week).
As opposed to the way that congregate living lists are now being managed, once a workplace outbreak has been in resolved status for 56 days, it is still being dropped from the list.
As is the case with the congregate living lists, OHA is now reporting cumulative cases since the beginning of the pandemic. There have been 45 deaths (up from 37 last week) and 9,226 cases (up from 8,605 last week) associated with all workplace outbreaks that have been reported to date. Cases attributed to workplace outbreaks account for 18.7% of all cases in Oregon.
OHA has clarified that there may be cases that are being double-counted as workplace outbreaks, i.e., if a worker or family member is associated with an outbreak at more than one facility: Cases that are associated with more than one workplace outbreak will be reported in the case count for all relevant workplace outbreaks.
Prisons make up 41% of all the active workplace outbreak cases (down from 42% last week).
Childcare Outbreaks
OHA has changed the way that it reports outbreaks in childcare facilities. Previously, the Weekly Report only included names and case counts for childcare facilities that enroll 30 or more children and have five or more cases. They are now reporting all outbreaks that include two or more cases in facilities with more than 16 children.
There are now 15 (down from 16) facilities listed as active. They comprise a total of 84 cases (up from 71).
These case counts may include children, staff, and household members.
Thirteen centers are now on the Resolved list (up from 9), comprising 77 (up from 68) cases.
In addition to the listed centers, there is one childcare facility that serves 16 or fewer children that has had an outbreak of 2 or more cases. (For privacy reasons, the smaller centers are not listed by name.)
Cases in K-12 Schools
OHA is now reporting all COVID-19 cases in schools that offer in-person instruction, distinguishing between students and staff. The report lists schools with at least 30 students that have at least one reported COVID case.
The new reporting protocol applies to all public and private schools and programs.
This week’s report on schools with in-person instruction shows 36 (up from 35 last week) cases of students and 42 (up from 24 last week) cases of staff members at a total of 35 (up from 24) public and private schools (including elementary, middle, and high schools) around the state.
Twenty-six schools have now been moved into the “Resolved” category (up from 19), meaning that it’s been more than 28 days since a new case was reported. They comprise 17 students and 31 staff members.
Infections by Zip Code
You’ll see that the zip code list again reveals the various hot spots around the state, presented in terms of cases per 100K residents since the beginning of the pandemic. Since these are cumulative totals, change in zip code rankings happens slowly over time.
The top five are exactly the same zip codes east of the Cascades (from Umatilla/Morrow, Jefferson, and Malheur Counties) as they’ve been for the last two months:
- 97818 (Boardman in Morrow County)
- 97761 (Warm Springs in Jefferson County)
- 97914 (Ontario in Malheur County)
- 97838 (Hermiston in Umatilla and Morrow Counties)
- 97882 (Umatilla in Umatilla County)
97913 (Nyssa in Malheur County) remains in the on-deck spot at #6.
Here is a zip code locator for you to use as you look at the zip code numbers.
The Oregonian has created an interactive map of cases by zip code. It allows you to see COVID cases both cumulatively and with changes over the last week.
Sunday Wildfire Recovery/Response Update
Nothing new to report on the firefighting front today now that the rains have returned in force. Again, you can follow the remaining firefighting effort at the State of Oregon Fires and Hotspots Dashboard.
The Office of Emergency Management is no longer giving us regular reports on wildfire recovery. However, for the very latest numbers, OEM is now maintaining a real-time Wildfire and Recovery Tracker that will give you up-to-the-moment statistics on a variety of metrics related to recovery efforts.
Where Are Today’s New Cases?
If we put together the positive test results and new “presumptive” cases reported today, the overall number of new cases for today is 868. More than half of the new cases are from outside the Portland Metro Area today. Here is the breakdown by county for today:
Benton (13)
Clackamas (86)
Clatsop (3)
Columbia (8)
Coos (5)
Curry (2)
Deschutes (13)
Douglas (16)
Gilliam (1)
Harney (5)
Hood River (7)
Jackson (37)
Josephine (4)
Klamath (2)
Lake (3)
Lane (57)
Lincoln (2)
Linn (6)
Malheur (12)
Marion (176)
Multnomah (184)
Polk (18)
Umatilla (47)
Union (19)
Wasco (6)
Washington (110)
Yamhill (26)
And the Deaths
Oregon's 760th COVID-19 death is an 81-year-old man in Umatilla County who tested positive on Oct. 27 and died on Nov. 8 at Good Shepherd Hospital.
Oregon's 761st COVID-19 death is a 66-year-old woman in Umatilla County who tested positive on Nov. 2 and died on Nov. 13 at OHSU
Additional Graphs:
    Want to See Past Newsletters?
If there was COVID-related information in a past newsletter that you want to go back to, but find you’ve deleted it, you can always go to my legislative website (senatordembrow.com), click on “News and Information,” and you’ll find them all there. Also, if someone forwarded you this newsletter and you’d like to get it directly, you can sign up for it there.
AND FINALLY,
Here again are some resources that you will find useful:
If the above links are not providing you with answers to your questions or directing you to the help that you need, please consider me and my office to be a resource. We’ll do our best to assist you or steer you in the right direction.
Best,
 Senator Michael Dembrow
District 23
email: Sen.MichaelDembrow@oregonlegislature.gov
web: www.senatordembrow.com
phone: 503-986-1723
mail: 900 Court St NE, S-407, Salem, OR, 97301
|