RITIS tool makes data analysis easy
 On Dec. 6, 2021, Interstate 5 shut down in north Portland for seven hours. People were stranded — in cars, buses, on bicycles, wherever they got stuck. The shut down was due to a fatal armed carjacking incident; a nightmare for all involved. The people who couldn’t get on with their days paid a smaller price, but how do you put a monetary value on the delay? Well, now there is a way to calculate it.
A new tool called the Regional Integrated Transportation Information System, or RITIS, is helping ODOT stay ahead of the technology curve by making data easily accessible for transportation professionals conducting system monitoring and analysis.
Developed by the University of Maryland, RITIS offers more than ten thousand operations that planning transportation professionals can use to support their work.
Lots of great data
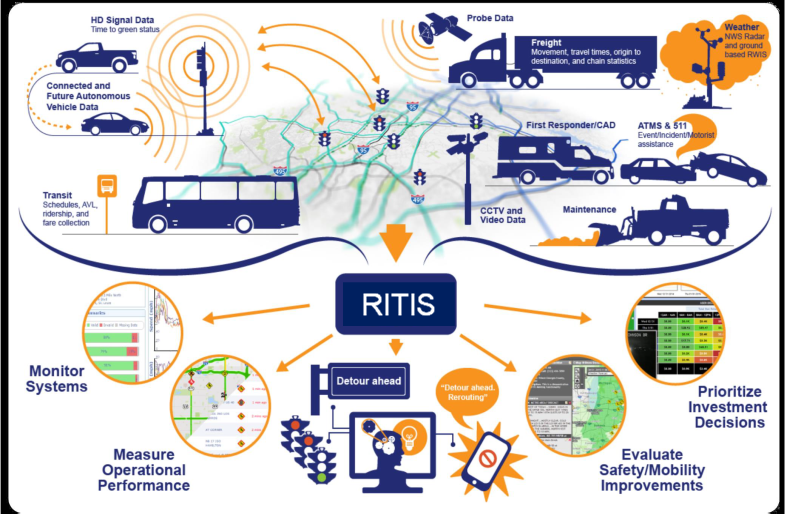
RITIS is a data integration tool that allows each state subscriber to submit agency data into the existing RITIS database. The major sources of RITIS data are third party vehicle probe speeds (INRIX) and incidents (WAZE); ODOT incidents and other events; ODOT sensors and detectors; and weather data from NOAA. The tool then fuses the data and provides access through an interactive user-friendly website.
Users can select a highway segment, analysis time period, and performance measures, and the tool will produce easy-to-understand data summaries through charts, tables, and graphs. Among the data sources, the probe speed data from INRIX is one that ODOT purchases additional detailed data above and beyond what RITIS uses as default. INRIX reports speeds on roadway segments by collecting information from mobile devices (phones, tablets), connected cars, delivery vans, trucks and other fleet vehicles equipped with GPS locator devices. This probe data provides real-time and historic traffic speed information on Oregon roadways.
What kid of information can users pull from the RITIS platform to help with their work?
- Speed, travel time, reliability, user delay cost.
- Bottleneck location and duration, bottleneck ranking.
- Incidents and events.
What applications can RITIS help users with?
- System performance monitoring and reporting.
- Work zone analysis.
- Before and after studies for projects.
- Traffic model calibration.
“Anyone interested in the data can log into the platform and look around to find what they are looking for,” said Chi Mai, ODOT Transportation System Analysis engineer in the Transportation Planning Analysis unit.
Great valuable information
To calculate the cost to the users who were stuck in the Dec. 6 I-5 shutdown, Mai used the RITIS platform. She pulled information for Multnomah County and Clark County and calculated the increase in vehicle hours and monetized the cost in delay.
“RITIS is very user friendly and customizable,” said Mai. “There are various pull down menu choices so you can pick exactly what you want to look at. It’s a great tool for analysts or planners to pull the information they need and insert it in their reports.”
For example, you can pick time periods of one day to one year or multiple years. You can select weekdays or weekends, one highway segment or a highway corridor or roadways within a county or multiple counties, cars versus trucks, etc. Once you submit the parameters of your data pull, it comes back with a display of the summary results.
“ODOT has made a substantial investment in this tool and we want to make sure that everyone who has a need to use it knows that it’s available,” said Mai.
Staff working for a public agency or university within Oregon and Clark County, Washington and consultants working under contract on behalf of public agencies can gain access to RITIS at no cost.
There are short video tutorials within the tool to assist users, and by early next year a best practices handbook will be available. In the meantime, check out the RITIS website to learn more.
|
