State Public School Enrollment
Inches Up in 2016
OKLAHOMA CITY (Jan.
18, 2017) – The number of students enrolled in Oklahoma public schools continued
to rise in 2016, increasing by more than 1,000 from the previous year.
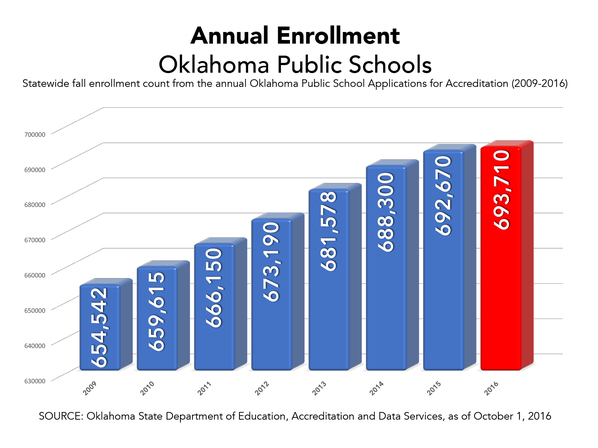
A total of 693,710 students were enrolled in
pre-kindergarten through 12th grade at the start of the school year, an
increase of 1,040 over the 2015 total of 692,670 and 27,560 more than in 2011.
State Superintendent of Public Instruction Joy Hofmeister said
the increase in enrollment does not come as a surprise.
“Oklahoma schools are educating more students than ever
before. Over the past decade, student enrollment has risen steadily, as have
funding challenges. We must do everything we can to maximize our resources in
order to serve a growing and increasingly diverse group of Oklahoma
schoolchildren,” Hofmeister said.
Districts record enrollment every year on Oct. 1 and report
the figures to the Oklahoma State Department of Education. Currently, Oklahoma
has 513 public school districts and 1,787 school sites, including 13 charter
schools not sponsored by a district.
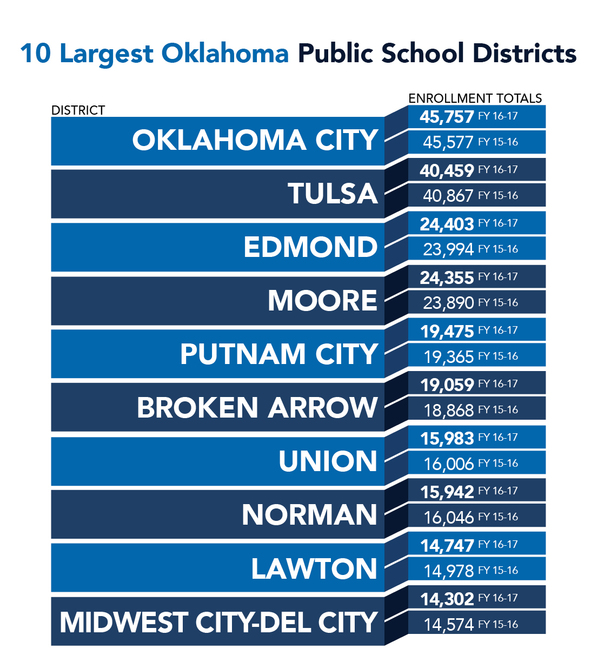
The list of the 10 largest districts is identical to last
year’s, although some changed position within the ranking. This year’s 10
largest districts are:
- Oklahoma City Public Schools: 45,757 students
- Tulsa Public Schools: 40,459
- Edmond Public Schools: 24,403
- Moore Public Schools: 24,355
- Putnam City Schools: 19,475
- Broken Arrow Public Schools: 19,059
- Union Public Schools: 15,983
- Norman Public Schools: 15,942
- Lawton Public Schools: 14,747
- Mid-Del Schools: 14,302
Among those districts, Moore had the greatest year-to-year
growth, increasing 1.95 percent over 2015, followed by Edmond with an increase
of 1.7 percent and Broken Arrow, which jumped 1.01 percent. Putnam City
and Oklahoma City grew less than 1 percent. Enrollment decreased up to 2
percent in Union, Norman, Tulsa, Lawton and Mid-Del.
Statewide, student population percentages shifted slightly
this year. Most significantly, the percentage of white students dipped below 50
percent in the first time in state history. The number of Native American
students also decreased, while the percentage of Hispanic students and students
of two or more ethnicities increased. This school year, Oklahoma’s student
population is*:
- 49.36 percent white
- 16.81 percent Hispanic
- 13.94 percent Native American or Alaskan Native
- 8.77 percent black
- 8.78 percent two or more races
- 2.34 percent Asian, Hawaiian or Pacific Islander
*Numbers are rounded and may not add up to 100.
To view the spreadsheets with state, district and site totals, visit http://sde.ok.gov/sde/documents/state-student-public-enrollment
###
|