The Oklahoma Department of Emergency Management and Homeland Security has partnered with Oklahoma Forestry Services, Oklahoma Mesonet, and the National Weather Service Forecast Offices in Amarillo, Norman, Shreveport and Tulsa, to deliver this Preparedness Advisory Bulletin to emergency management partners in an effort to communicate impacts possible in Oklahoma from La Niña conditions for the remainder of this year and into early 2021.
 La Niña is the cold phase of the El Niño/Southern Oscillation (ENSO), and occurs when sea surface temperatures drop below average across the eastern Equatorial Pacific Ocean. As with its warm phase ENSO counterpart, El Niño, this disruption of sea surface temperatures and atmospheric circulation can impact weather patterns across the globe, including those in the Southern Plains. ENSO is a naturally varying climate pattern, and its different phases can persist for several seasons or several years. In addition to the warm and cold phases, there is also a neutral state in which the ocean and atmospheric conditions are within their long-term averages.
In order for La Niña conditions to be present, the temperature anomaly in the eastern Equatorial Pacific must reach at least -0.5°C; forecasts must show that the temperature anomaly will persist for several three-month periods; and winds, surface pressure, and rainfall must have at least begun to show changes consistent with La Niña. Those criteria were met during August according to forecasters at the National Weather Service’s Climate Prediction Center (CPC), prompting the CPC to issue a La Niña Advisory, with La Niña conditions observed and expected to continue through at least the Northern Hemisphere winter 2020-21. Strength of the ENSO event does seem to matter, with the moderate and strong episodes producing a higher frequency of significant impacts. The intensity of La Niña events are determined by the maximum sea surface temperature anomaly present during the episode: weak, to -0.9°C; moderate, -1.0°C to -1.4°C; strong, -1.5°C or greater. CPC forecasters favor an event of borderline moderate intensity during the peak November-January season.
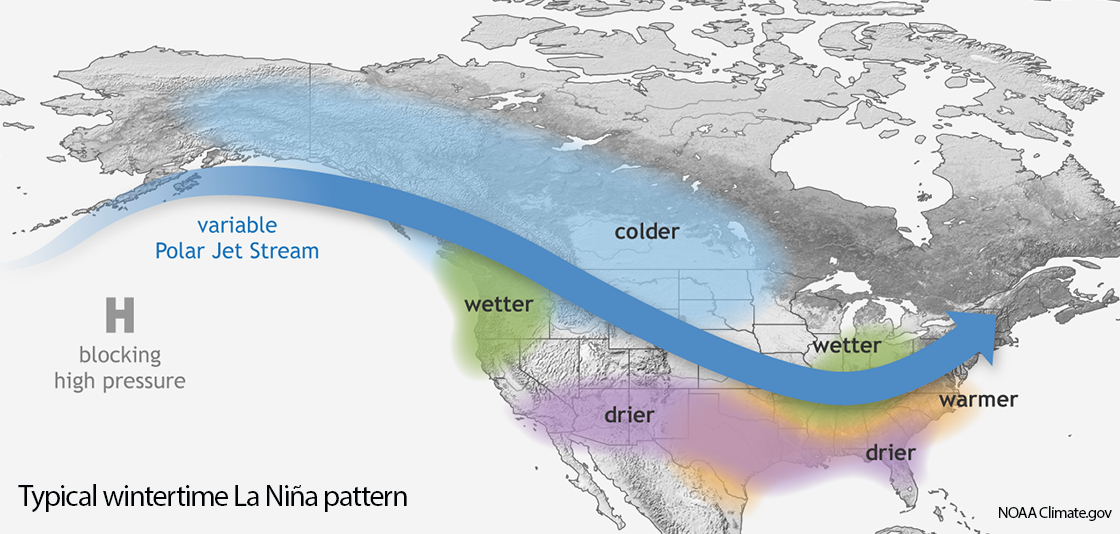
The shift in the air patterns across the equatorial pacific in turn disturbs the average location of the mid-latitude jet streams over the United States in what is known as a “teleconnection.” During La Niña, the jet stream meanders farther to the north, leaving the southern tier of the United States with fewer storm systems. The impacts most common in the United States are above normal temperatures and below normal precipitation across the southern one-third of the country and cooler and wetter than normal weather in the Pacific Northwest and Ohio Valley. The impacts due to La Niña are normally strongest from late fall through early spring in the Southern Plains, although not every La Niña produces the typical impacts.

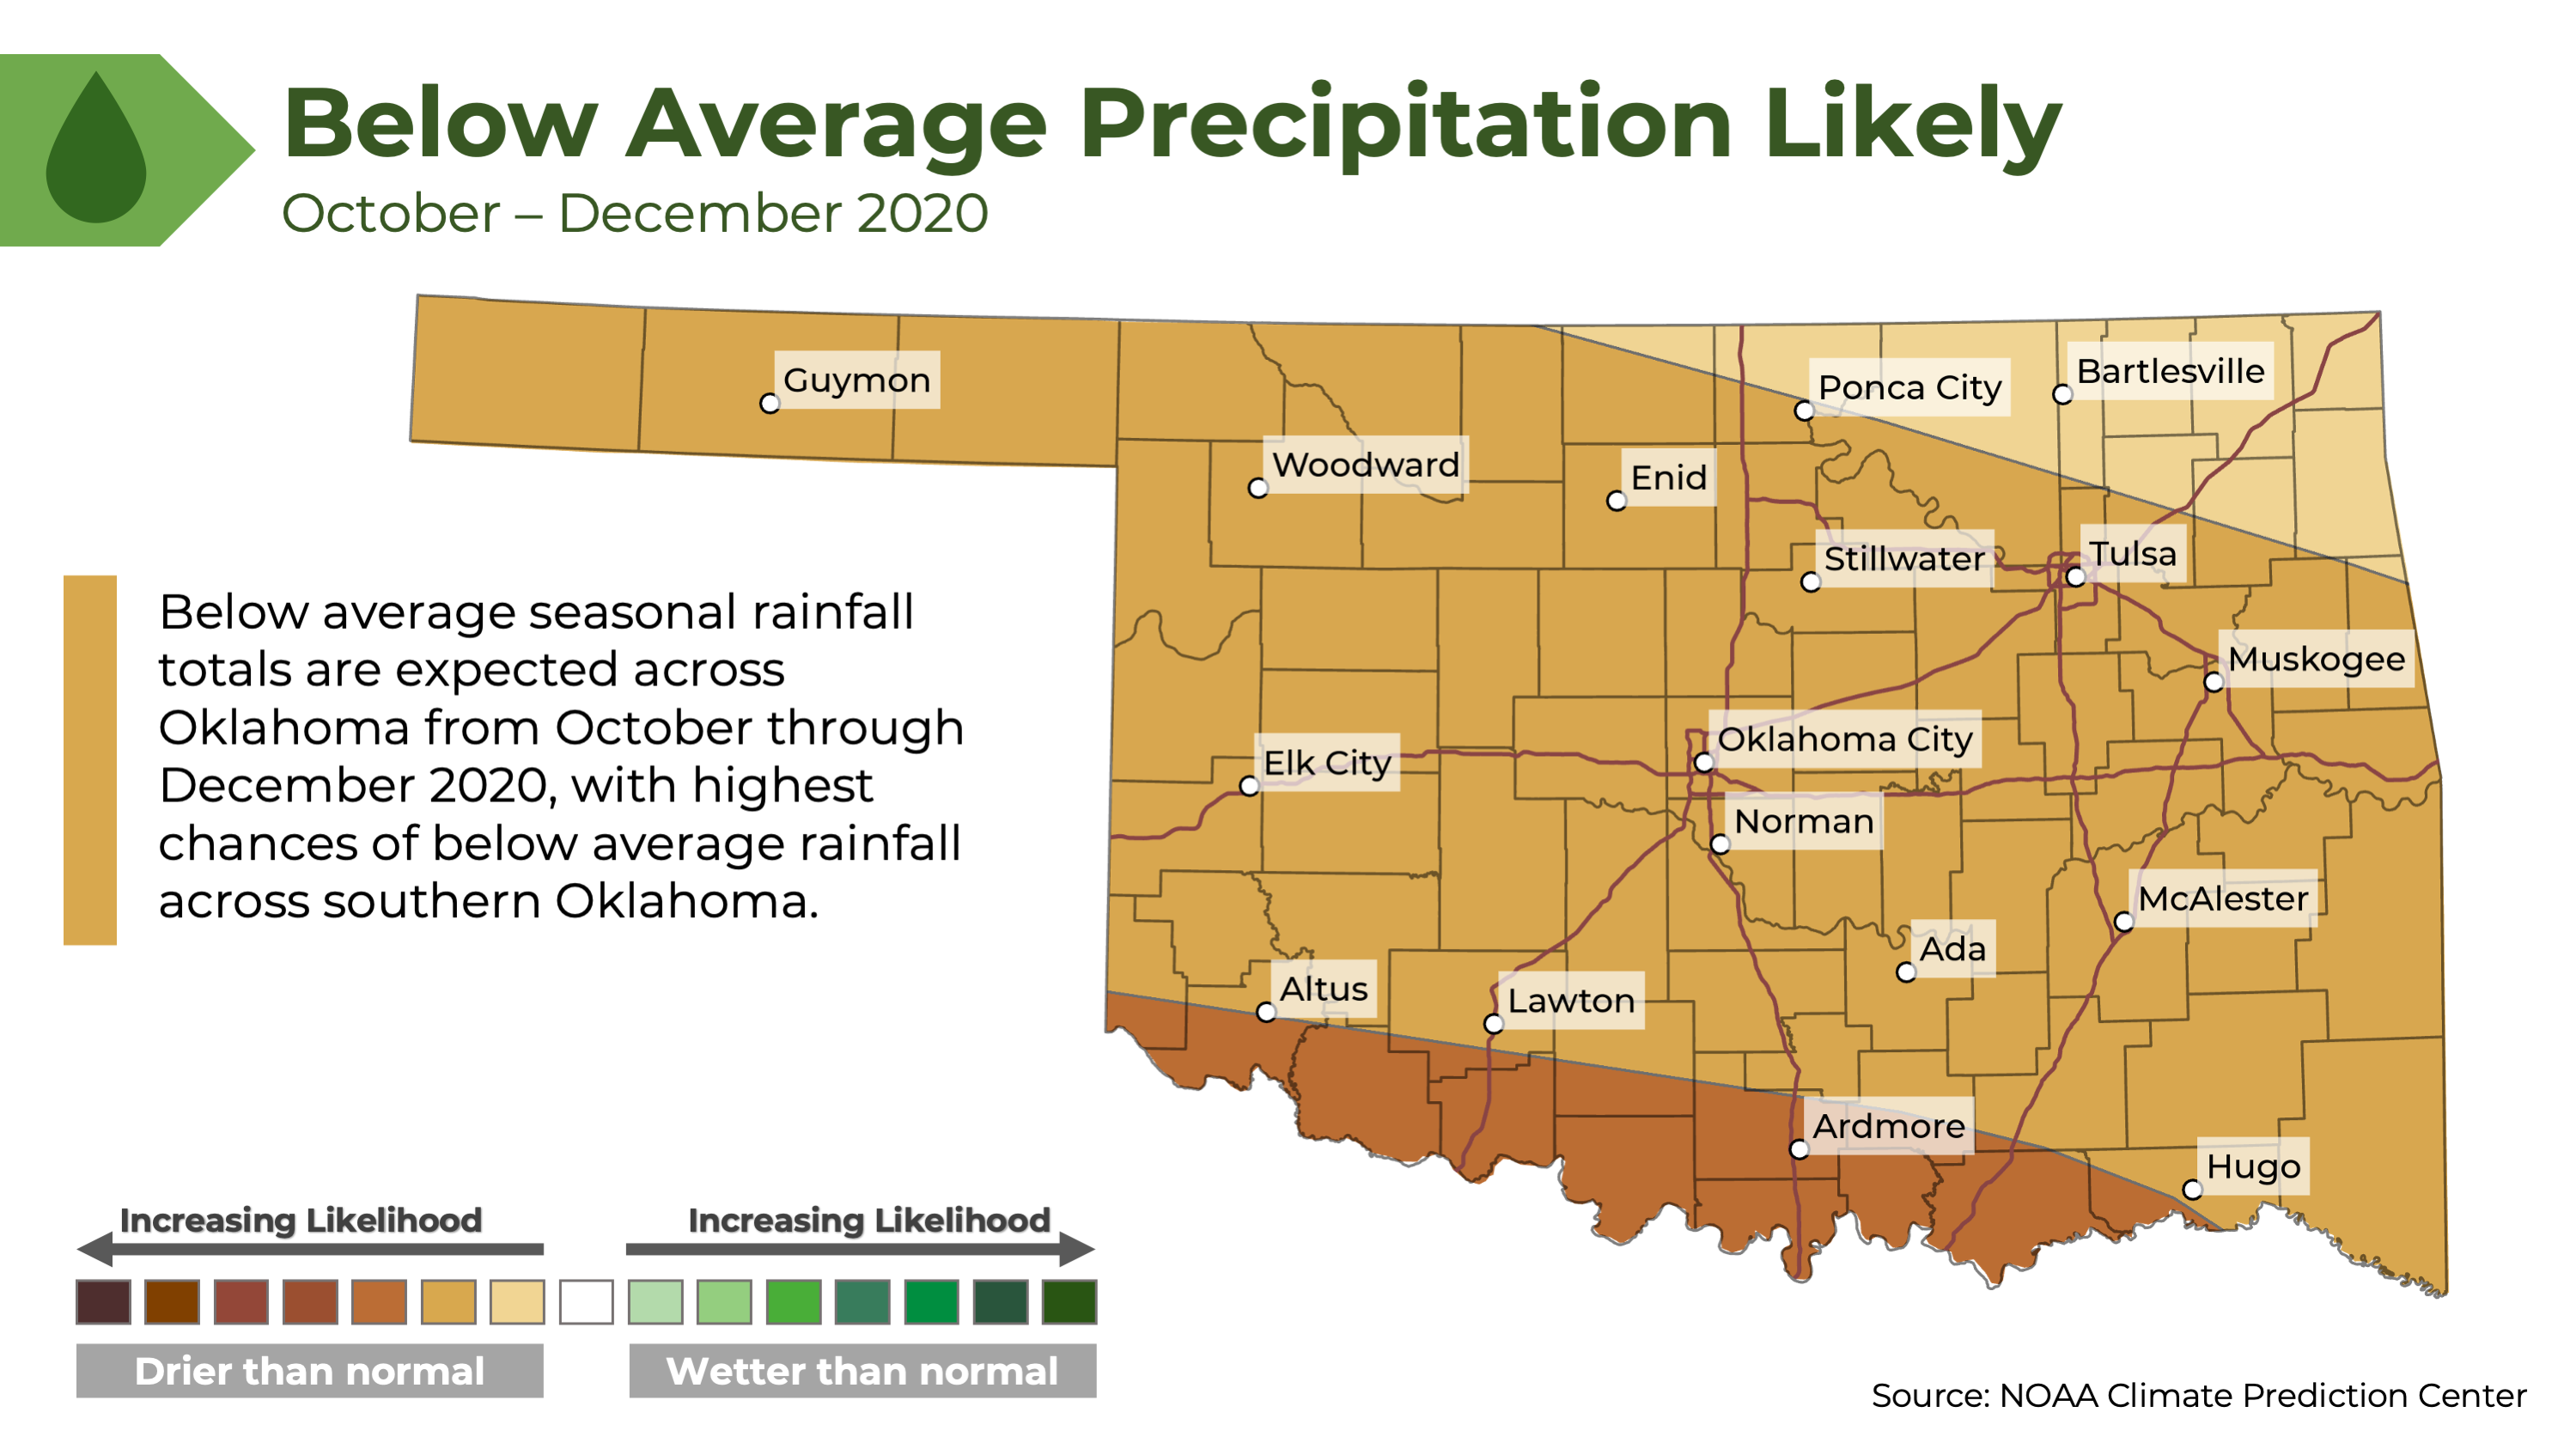
Information provided below should be interpreted as seasonal outlook information, and does not exclude possibilities of potentially significant events contrary to overall trends. For example, a strong likelihood of below average seasonal rainfall does not exclude isolated heavy rainfall or flooding events. Instead, it represents that during the outlook period, overall rainfall totals would likely be below average.
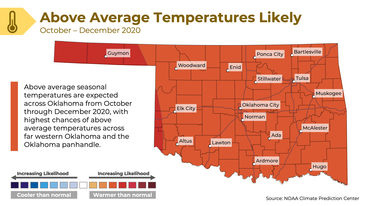
There is generally less precipitation and snow during La Niña winters, although the region is on the northern edge of the typical winter dry signal for weaker La Niña events. While there can be strong arctic fronts, temperatures generally tend to average above normal overall for the season. These are both most likely outcomes for this winter, but this does not rule out a major winter storm from occurring. La Niña episodes typically result in warmer than average temperatures across the majority of Oklahoma. Far western Oklahoma and the Oklahoma panhandle have the greatest chances of experiencing above average temperatures.
|
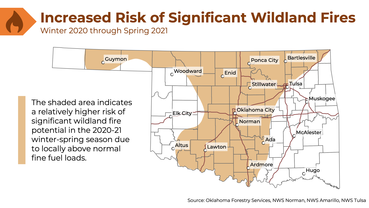
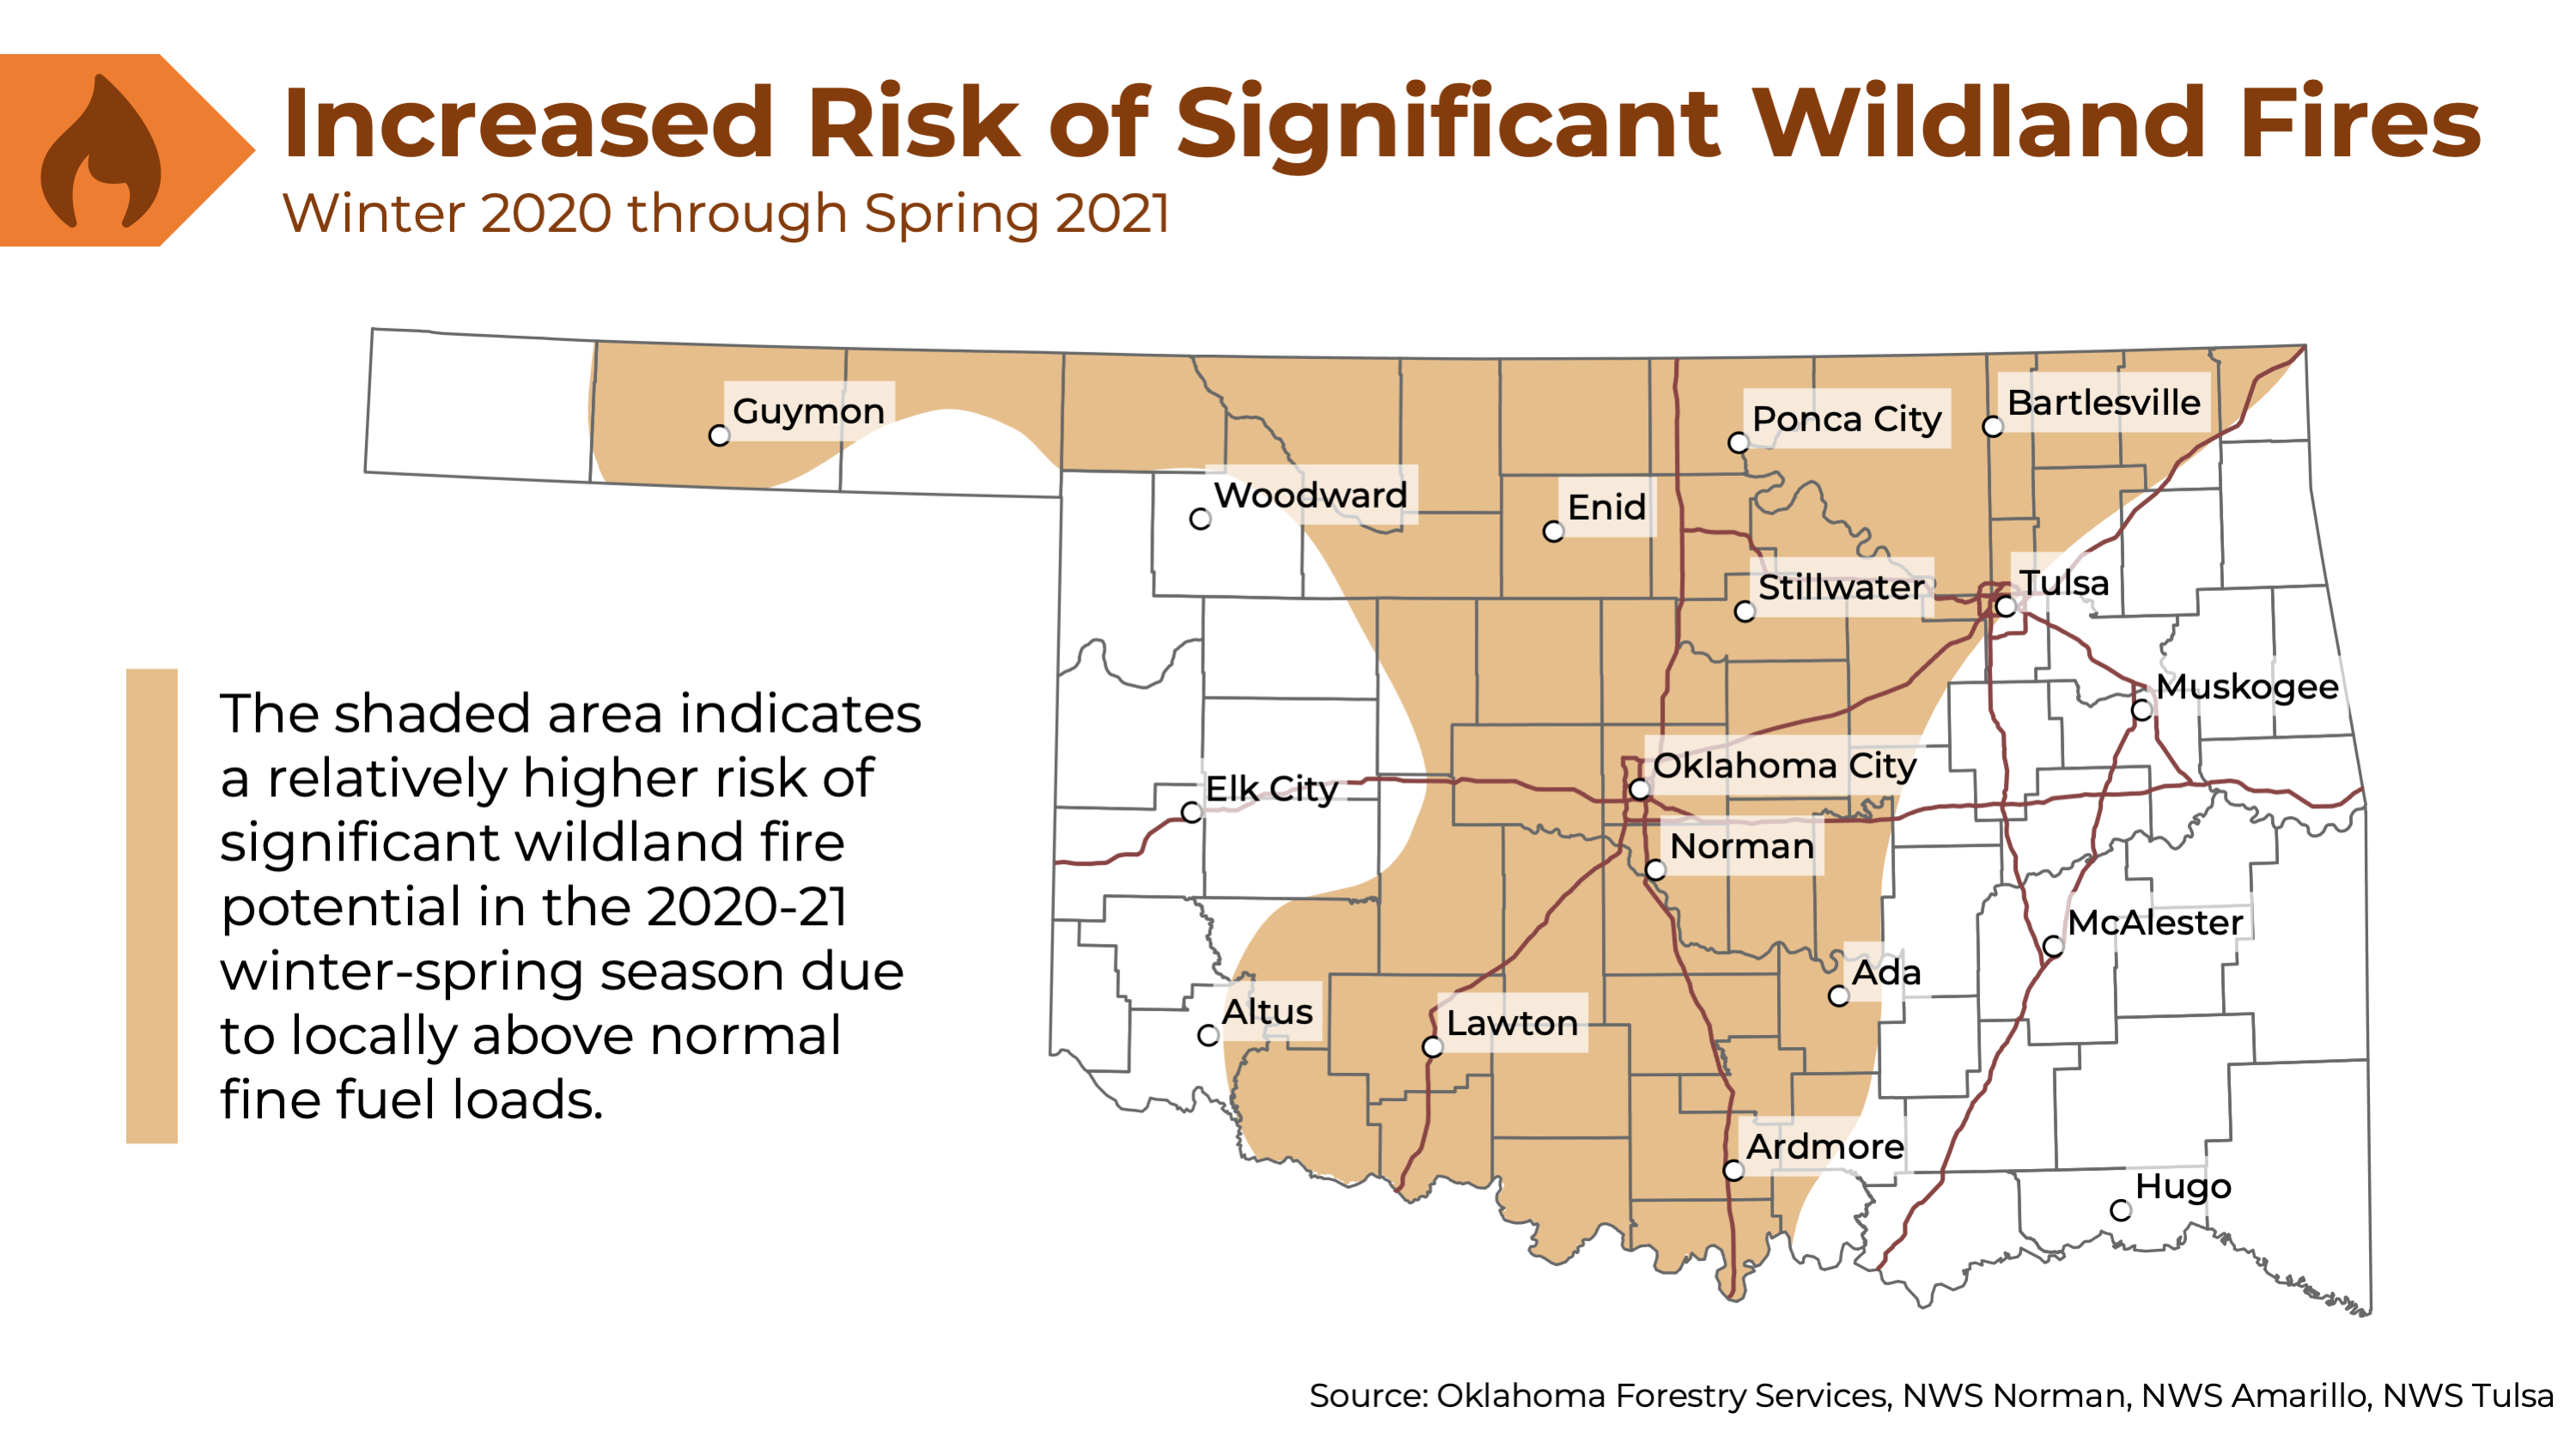
Wildland fire activity will increase relative to the past two years during the upcoming 2020-21 winter and spring dormant season. Predominantly normal to slightly below normal grassland fuel loads will regulate fire intensity to high levels of initial attack throughout much of the season. However, a few intense/damaging fire episodes will be possible during high-end fire weather, especially where a patchwork of locally enhanced fine fuel loads exists from the Flint Hills, south and westward across the prairies of central Oklahoma, northwestward to the central Oklahoma Panhandle. Prolonged periods of drying may additionally increase fire risks in timbered areas of the state.
|
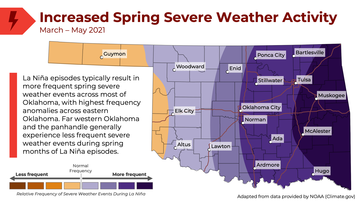
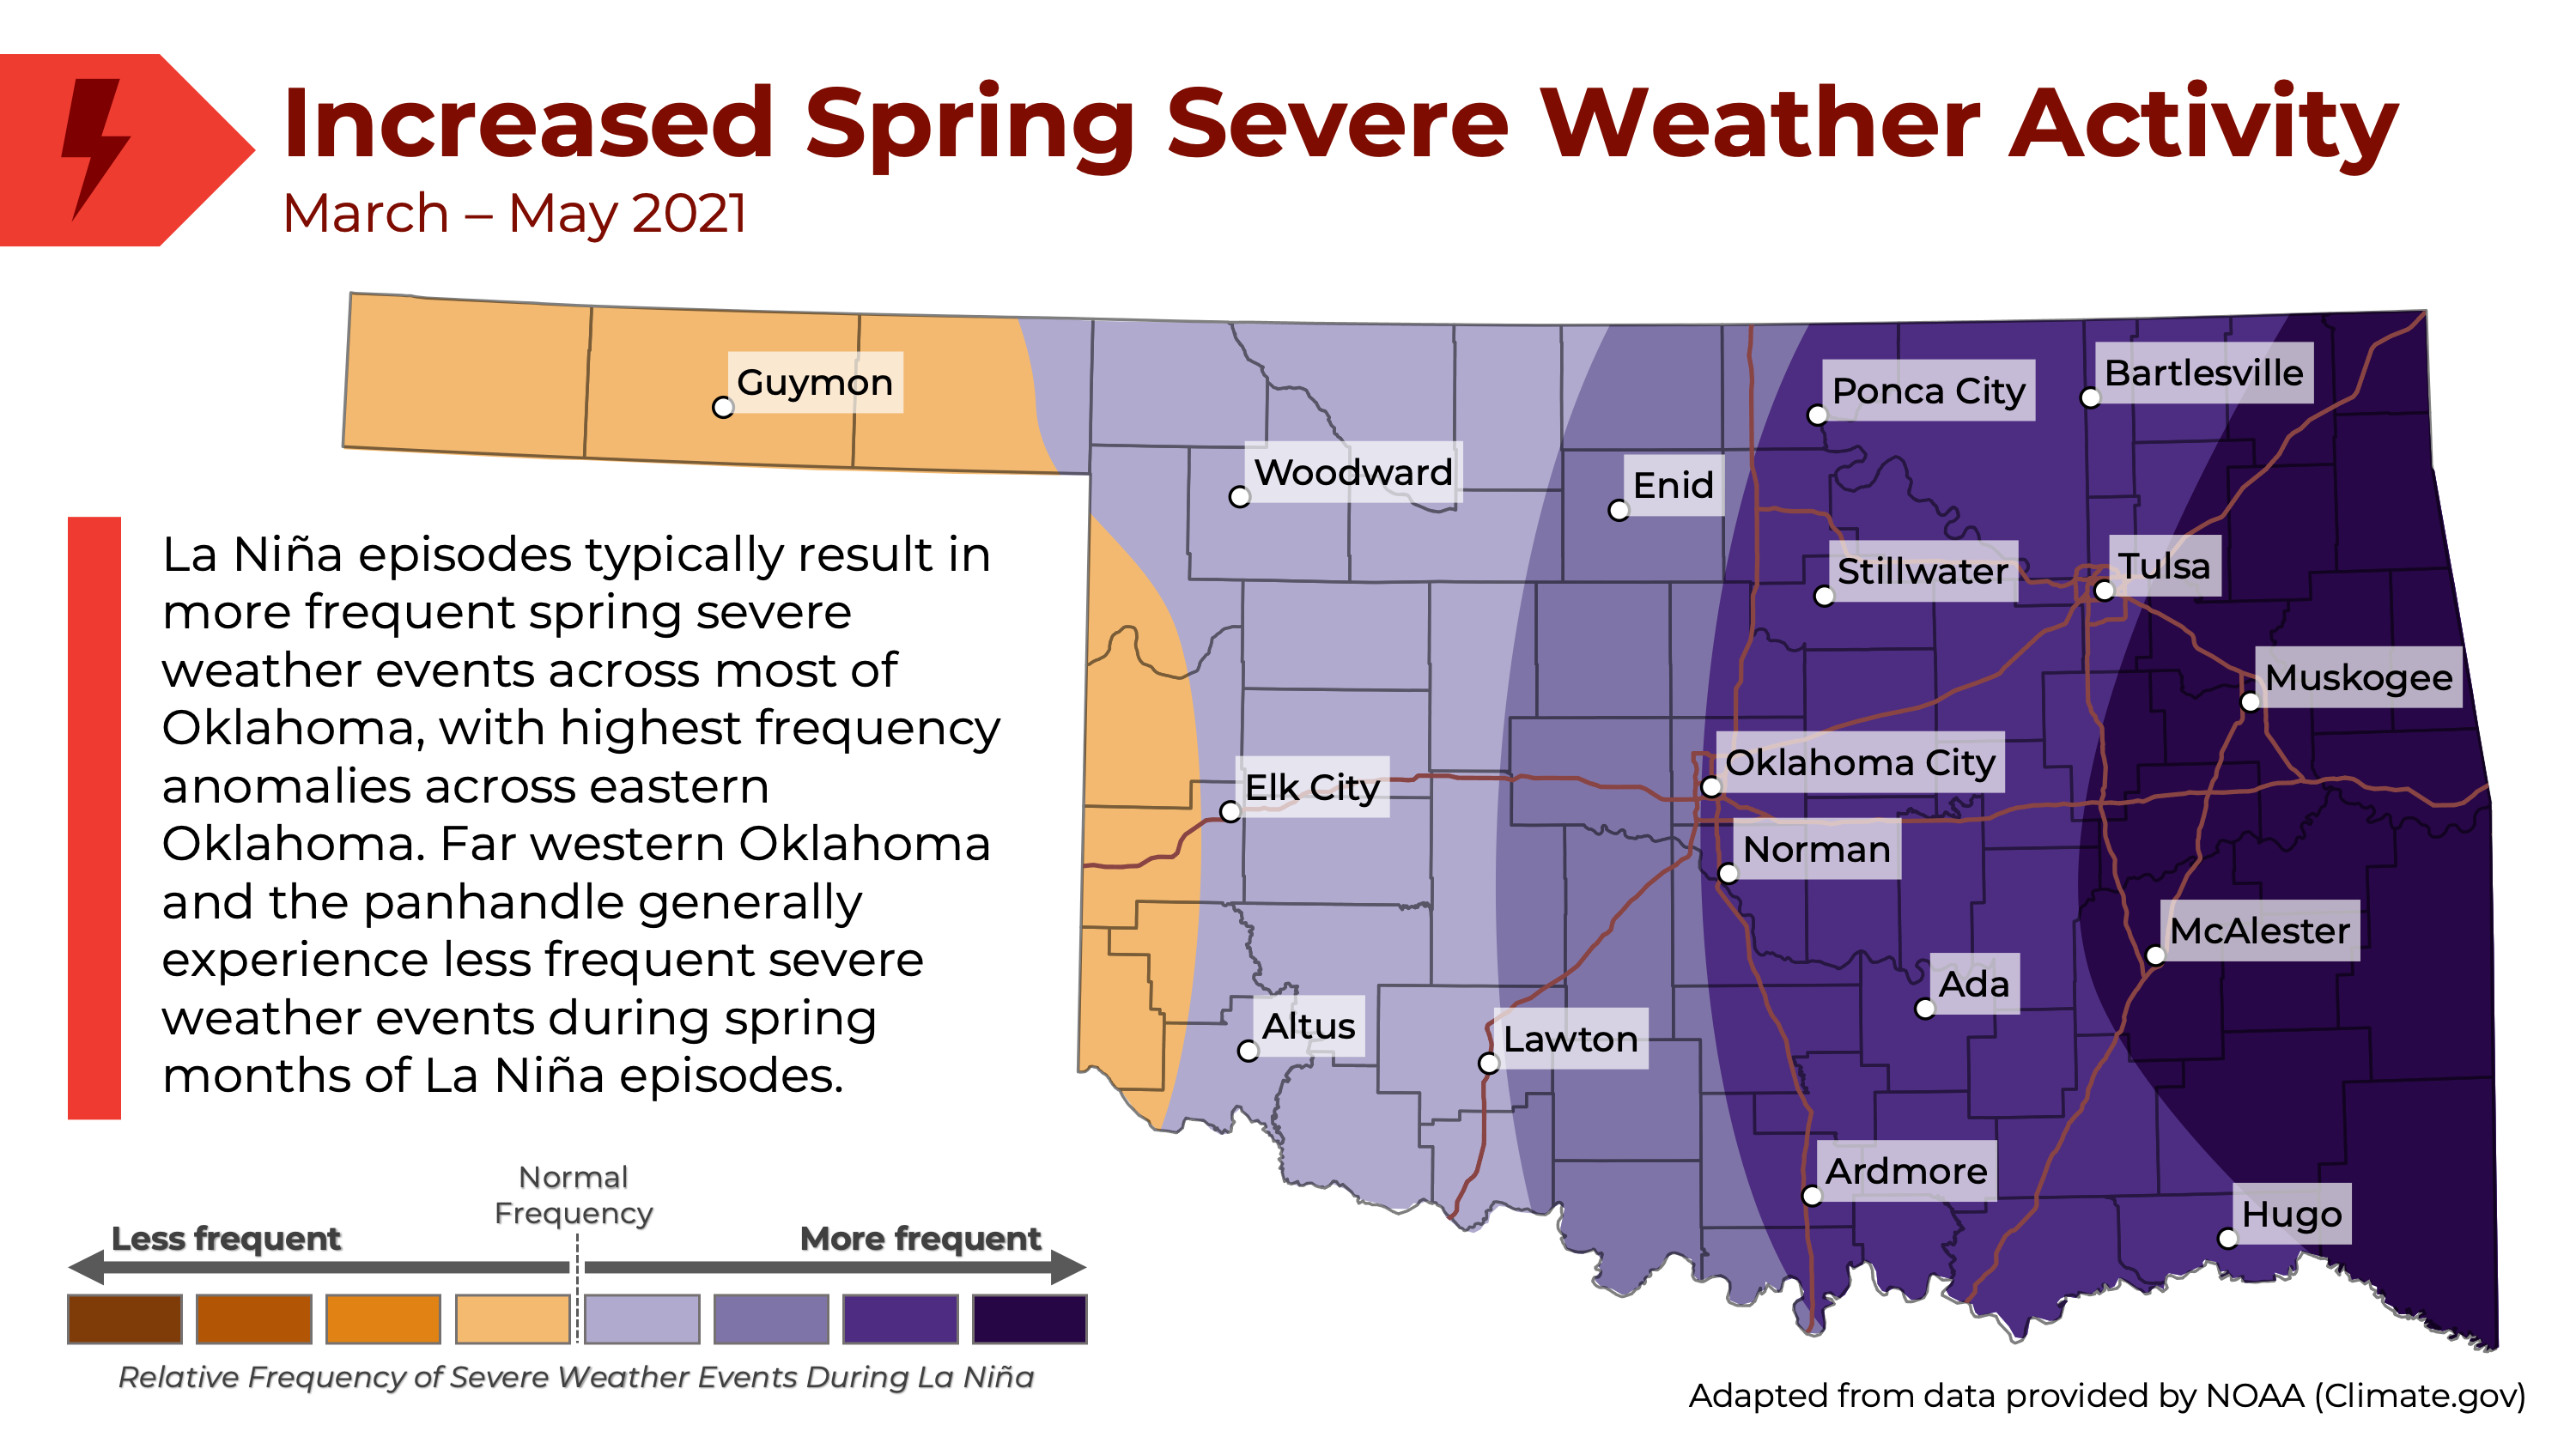
During spring months of La Niña episodes, the frequency of severe storms generally increases across central and eastern Oklahoma, with a greater than average frequency of hail and tornado events from March-May. Conversely, the frequency of severe weather events across far western Oklahoma and the Oklahoma panhandle is generally below average during spring months of La Niña episodes. The Oklahoma panhandle is likely to experience fewer severe weather events than normal this fall, with this trend expected to continue into the spring months of 2021.
|
With this information, now is the time to be proactive, promote additional community preparedness and build readiness. Some examples of next steps to help build community preparedness and response capabilities include:
- Reviewing and updating emergency operations plans
- Providing training and conducting exercises to enhance local capabilities
- Building and formalizing mutual aid agreements and memorandums of agreement or understanding for support resources
- Exercising local EOC activations with local officials
- Practicing the use of virtual collaboration tools which may be used during an emergency response, due to COVID-19
- Developing more drought, wildfire and severe weather preparedness and action content for residents through social media
As we’ve learned from past disasters, neighbors helping neighbors is often what makes emergency management in Oklahoma shine. Preparations made for your jurisdiction may be just as valuable for neighboring communities during an emergency.
ODEMHS stands ready to support jurisdictions in leaning forward and is available to help coordinate training and exercise needs, including training on OK EMGrants and FEMA Grants Portal, as well as help facilitate meetings to discuss and organize regional mutual aid partnerships. Our Public Information team has developed social media content specific to many hazards, available at any time in WebEOC under “Social Media Toolkit.” The National Weather Service also has social media resources and safety campaigns available online for each season. For more information on developing a social media plan for emergency management, visit https://smemguidancetool.org.
|