|
 by Brooklynn Burchett, Research Specialist, and Steven Koczak, PhD, Research Specialist
Surveys are common in the U.S. today. So long as there is room for improvement in some process, somebody will seek feedback for better decision-making. So long as there is a need for data that can’t be gleaned from an existing source, someone will seek it. At times the most efficient method to generate brand new data is to ask others directly.
The New York State Department of Labor (NYSDOL) established a Survey Unit (DSU) in 2025 to provide high-quality support, primarily to other operations within the Department, that need to collect and analyze information through surveys. In late 2025, the DSU undertook an extensive survey of businesses and job seekers for DOL’s Office of Workforce Development (OWD). The questionnaire sought to uncover important labor market trends in the state and shed light on the needs of both businesses and job seekers. In turn, OWD would use the information to identify how we can better match solutions to the challenges that workers and employers face.
The DSU conducted separate electronic surveys — about 30 questions each — of businesses and job seekers. The business survey had 6,906 responses, and the job seeker survey had 8,582. DSU analyzed questions according to how many respondents answered each prompt, rather than how many engaged in the survey overall. While the DSU collected data on many topics, the focus of this article is on the barriers to hiring and getting a job.
The survey asked job seekers to rate, on a scale of 1-5, the severity of 19 potential barriers to getting a job. A score of 5 rated a barrier as a “severe obstacle” to finding work. A score of 1 indicated this factor was “not an obstacle.” On the flip side, the survey asked businesses to score the most common barriers preventing them from hiring a job candidate. Job seekers’ responses were scored 1-5. Business responses were binary: either “1” (factor is a barrier to hiring) or “0” (factor is not a barrier to hiring).
Job seekers in New York cited age discrimination as the most encountered “severe” obstacle to being hired (20% of respondents). Most job-seeker respondents reported being over 45, which may have skewed the results, as we found that older respondents rated age discrimination as a stronger barrier. Even after considering the older group in our sample, prior research suggests our respondents’ concerns may be legitimate (see Batinovic et al. and Neumark et al.) Other forms of discrimination reported popped up in the survey in the free-form answer section for barriers to employment. Respondents cited several bases for discrimination, individually and in combination.
Another social phenomenon — the lack of a large professional network — came in second. About one in six (16%) of respondents reported this as a severe obstacle (and 67% of respondents reported it as an obstacle to some degree). Research doesn’t always show that having a large professional network helps you find a job. However, networks can help to secure referrals. Though referrals barely showed up in the results of our business survey, prior research has shown that referred workers are less likely to quit, and businesses showed concern about high turnover elsewhere in this survey.
While networking is a skill that can be improved, some prior studies have suggested that socioeconomic status impacts network quality in ways job seekers cannot control (see Schepper et al.). In our results, demography emerged as a factor in concerns about professional networks, in a way that lined up with concerns about historic or ongoing marginalization.
Of course, even the greatest professional network usually can’t get you a job you’re wildly unqualified for. Not possessing the right degree, certificate, or credential was the third largest obstacle cited by job seekers. More than half of job seeker respondents (57%) cited this as an obstacle to one degree or another, and 15% rated it as severe. Older and higher-educated job seekers were less concerned about their qualifications.
Lacking specific degrees, certificates, or credentials also emerged as a barrier in free-form responses. Other obstacles mentioned were health conditions, language barriers, transportation problems, a lack of basic computer skills, family care responsibilities, and the overall state of the economy and job market.
Business respondents gave more concentrated responses than job seekers. Regardless of industry or firm, there was a clear standout — lack of experience in the candidate pool. More than half of businesses (54%) agreed that lack of experience was a barrier for them in hiring candidates.
Indeed, lack of experience was one issue on which job seekers and businesses found common ground — 48% of job seekers cited it as an obstacle, too. Given the inherent measurement differences between the employer and employee surveys, it was relatively close to the equivalent employer figure of 54%.
Other data from our survey, plus earlier research, suggest explanations that are simultaneously overlapping and contradictory. All businesses have roles that require experience, so this factor will of course show up repeatedly. At the same time, in recent years some employers may have started requiring applicants to possess experience for roles typically considered entry-level (AKA “experience inflation”). Applicants who lack experience may not get that first job. This can keep them out of the job market long-term.
Various methods exist for job seekers to either acquire experience or compensate for not having it (e.g., getting more education or formal training). The #2 hiring barrier cited by businesses, however, is harder to get around — 36% of companies identified lack of interpersonal or communication skills among applicants as a barrier. By contrast, only 25% of job seekers thought this was an obstacle to finding employment to any degree, ranking it #12 of the 19 factors listed.
The #3 hiring barrier cited by businesses was applicants lacking education or training, with 33% reporting it was an issue. Businesses show less concern than job seekers in this area — only a third of businesses versus half of job seekers.
The top two barriers cited by applicants — age discrimination and the lack of a professional network — are not reflected in the business results. Job seekers’ responses to our survey indicated that they sometimes recognize that the lack of people skills can be an issue, but they didn’t rate it anywhere near as highly as did business respondents.
Some overlap between these seemingly disparate concerns is possible to see. Articles in the popular business press have sometimes described members of Gen X and Gen Z as unemployable. One way to interpret the informal findings of these popular articles is that there is a communication gap — based on peer style, slang, and the like — between employees and employers. Some of this communication gap may overlap with unintended age discrimination by employers, job seekers’ perceiving discrimination (even if they’re wrong), or job seekers’ lack of a professional network to link them to opportunities and vouch for them. Such factors would be difficult to assess.
This disconnect can also arise from different perspectives on the hiring process. Businesses generally assess interpersonal and communication skills during job interviews or recordings that mimic interviews. Some applicants may lack experience with those kinds of interactions. NYSDOL has resources to help applicants improve their overall interviewing skills, including free access to InterviewStream, a digital interview and recruitment platform.
The disconnect regarding education and training can be explained similarly — both sides experience this at different points in the hiring process. Applicants hit this wall every time they don’t meet the minimum qualifications in a job posting. But for businesses, the issue is only apparent when someone applies without those minimum qualifications.
Data and research to address workforce challenges can inform policy, public conversations, legislation, and systems, but those changes often happen over time, whereas our workforce and employers need immediate relief. The bottom line is that job seekers need jobs and businesses need workers. So, what to do?
It may be useful for both employers and applicants to focus on what factors they control. Job seekers can work to expand their network as a path to opportunities, explore ways to gain experience, seek help to make resumes better reflect their experience, and use available resources to practice their interview skills. Businesses can network with schools and organizations to create pipelines of qualified workers and can review hiring practices to remove unintended bias and ensure they ask the right questions in the right way.
The New York State Department of Labor is here to support job seekers and businesses as they face placement challenges. Find a Career Center close to you to receive more information on how we can help you find the job or candidates you need.
Job Seekers, Top 5 Severe Barriers
|
|
Barrier
|
% Citing Barrier as "Severe"
|
% Citing Barrier Exists
|
|
I experience discrimination because of my age
|
20%
|
63%
|
|
I don't have a large professional network
|
16%
|
67%
|
|
I don't have the right degree, certificate, or credential
|
15%
|
57%
|
|
I don't have enough experience in the field
|
10%
|
48%
|
|
I have insufficient education or training
|
9%
|
50%
|
Businesses, Top 5 Cited Barriers
|
|
Barrier
|
% Citing Barrier
|
|
Lack of experience
|
54%
|
|
Lack of interpersonal / communication skills
|
36%
|
|
Insufficient education / training
|
33%
|
|
Gap in salary or wage expectations
|
32%
|
|
Lack of reliable transportation
|
29%
|
|
|
“The eight-county Capital Region has been one of the bright spots for population change in New York State.”
by Kevin Alexander, Labor Market Analyst, Capital Region
The U.S. Census Bureau counts each resident of the country, where they live, on April 1, every ten years ending in zero, most-recently in 2020. The U.S. Constitution mandates this count to determine how to apportion the House of Representatives among the states.
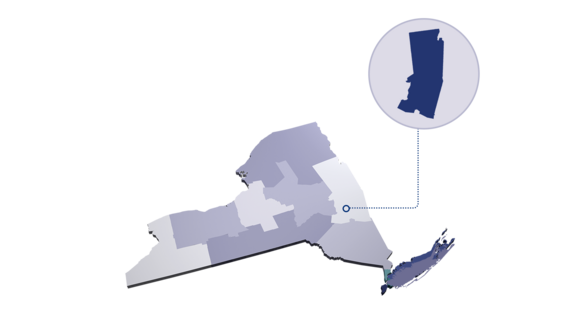
On an annual basis, the Bureau publishes estimates using births, deaths and migration data for the population as of July 1. This article uses Census data to show how, through the first half of the 2020s, the eight-county Capital Region has been one of the bright spots for population change in New York State. The region’s rate of growth trails only the Hudson Valley’s.
Regional Population Trends
As of July 1, 2025, the Capital Region’s population was estimated at just under 1.12 million. Since 2020, the region has added more than 12,600 residents, or a growth rate of around 1.1%. This represents the most rapid rate among Upstate New York’s seven labor market regions. Over the same timeframe, New York State’s overall population declined by about 120,000, or around 0.6%. The Capital Region’s net population growth in 2020-25 was centered in its three largest counties — Albany, Saratoga, and Schenectady.
On a percentage basis, Schenectady County had the fourth fastest growth rate between 2020 and 2025 among the state’s 62 counties. Two other Capital Region counties — Saratoga (#6) and Albany (#7) — ranked among the Top 10 counties statewide in terms of percentage growth.
The list below shows net and percentage population change between 2020 and 2025 for each county in the Capital Region:
-
Schenectady: +4,710 / +3.0%
-
Washington: -1,770 / -2.9%
On a net basis, Albany County recorded the largest net growth of any county outside New York City, Long Island, or the Hudson Valley, adding around 6,930 residents in 2020-25. The county’s net population growth was centered in the City of Albany (+2,830), the Town of Colonie (+1,440), and the Town of Guilderland (+1,360).
At 5,350, Saratoga County enjoyed the second largest net population increase in the region. Net growth was dispersed across several various municipalities. The largest population growth in Saratoga County between 2020 and 2025 was registered by three towns: Ballston (+1,670), Stillwater (+1,140), and Halfmoon (+950).
Schenectady County clocked in with the third largest net population growth in the region, adding 4,710 residents between 2020 and 2025. The City of Schenectady accounted for more than one-half of this growth with its resident count rising by around 2,540, while the Town of Niskayuna clocked in with a gain of 960 residents over this timeframe.
In the Capital Region, Washington County experienced the largest net population drop (-1,770) between 2020 and 2025 This decline was centered in the Town of Fort Ann (-1,500) and is a direct result of the 2024 closing of the Great Meadow Correctional Facility. The Census Bureau typically counts prisoners as residents of the correctional facility where they are housed on Census Day, under its "usual residence" rule, rather where they previously resided. In 2024, prisoners at Great Meadow were relocated to other state correctional institutions.
The Capital Region’s population experienced its largest annual increase in 2021, during the aftermath of the COVID-19 pandemic. In 2021, the region added 6,670 new residents and retained about half through 2022. Population growth has remained steady since, most recently increasing by 3,360, or 0.3%, from 2024 to 2025. By comparison, New York State’s resident count grew by only 1,010 residents, or less than 0.1%, in 2025.
From 2024 to 2025, Albany County gained 1,520 residents and Saratoga County gained a very similar 1,510 residents, ranking them #1 and #2 in Upstate population growth. In fact, four counties in the Capital Region — Albany (#6), Saratoga (#7), Schenectady (#10), and Rensselaer (#11) — ranked among the top 11 counties statewide in terms of net population growth in 2024-25.
In recent decades, families have been moving out of cities and into the suburbs. However, in 2025 several cities in the Capital Region saw their resident populations grow. In fact, the City of Albany had the second largest net population gain (+400) among all cities statewide, trailing only Yonkers (Westchester County), which is the third-most populous city in New York State. The City of Troy (Rensselaer County) grew by nearly half a percent in 2025, adding around 240 new residents. In addition, Saratoga Springs added almost 120, and the City of Schenectady’s population increased by 200 from 2024 to 2025.
Where people choose to live depends on a diverse mix of factors including, but not limited to, the availability of job opportunities, the cost of living (especially housing), public safety, transportation, climate, entertainment and cultural opportunities, and the quality of educational institutions.
Ultimately, the availability of good-paying employment opportunities remains atop the list of most individuals’ decisions about where to live. The diverse set of industries comprising the Capital Region’s employment base makes it attractive to new workforce entrants as well as individuals considering relocating to the area for a new job. In turn, the Capital Region’s broad economic diversity has helped contribute to its recent population growth.
To learn more about recent population trends in New York, visit the New York State Data Center, which operates as part of a nationwide effort to improve public access to data provided by the U.S. Census Bureau.
|
|

In July 2026, New York State’s seasonally adjusted private sector job count decreased over the month by 24,800, or 0.3%, to 8,429,500. In addition, the state’s seasonally adjusted unemployment rate fell from 4.6% to 4.4% in July 2026, while New York’s seasonally adjusted labor force participation rate decreased from 61.5% to 61.3%.
Over the past year, the private sector job count in the Capital Region increased by 1,300, or 0.3%, to 452,600 in July 2026. Employment gains were greatest in the following sectors:
- education and health services (+2,300)
- professional and business services (+1,000)
- manufacturing (+300)
Over-the-year job losses were greatest in the following sectors:
-
trade, transportation and utilities (-1,000)
-
financial activities (-800)
-
information (-300)
-
other services (-200)
The number of private sector jobs in the Syracuse metro area decreased over the past year by 2,200, or 0.8%, to 260,000 in July 2026. Job gains occurred in the following sectors:
-
leisure and hospitality (+700)
-
education and health services (+400)
-
other services (+300)
The largest job losses were in the following sectors:
-
trade, transportation and utilities (-1,500)
-
professional and business services (-1,000)
-
financial activities (-500)
-
natural resources, mining and construction (-300)
From July 2025 to July 2026, the number of private sector jobs in the Rochester metro area decreased by 1,800, or 0.4%, to 442,400. The following sectors added jobs over the past year:
-
leisure and hospitality (+1,500)
-
education and health services (+400)
-
other services (+400)
The largest over-the-year job losses occurred in the following sectors:
-
financial activities (-1,300)
-
professional and business services (-1,100)
-
manufacturing (-1,000)
-
trade, transportation and utilities (-400)
Over the past year, the number of private sector jobs in the Hudson Valley grew by 14,100, or 1.7%, to 866,100 in July 2026. The largest job gains occurred in the following sectors:
-
education and health services (+6,400)
-
trade, transportation and utilities (+1,700)
-
natural resources, mining and construction (+1,600)
-
leisure and hospitality (+1,400)
-
professional and business services (+1,100)
-
other services (+1,000)
-
financial activities (+800)
Job losses occurred in the following sector:
From July 2025 to July 2026, private sector jobs on Long Island increased by 7,500, or 0.6%, to 1,206,100. Employment gains occurred in the following sectors:
-
education and health services (+13,900)
-
professional and business services (+3,000)
-
other services (+200)
The following sectors had the greatest over-the-year job losses:
-
leisure and hospitality (-4,500)
-
financial activities (-1,600)
-
trade, transportation and utilities (-1,200)
-
manufacturing (-900)
-
natural resources, mining and construction (-900)
For the 12-month period ending July 2026, the number of private sector jobs in the Mohawk Valley region held steady at 143,500. The following sectors experienced over-the-year employment gains:
-
education and health services (+900)
-
trade, transportation and utilities (+300)
Job losses were largest in the following sectors:
-
leisure and hospitality (-500)
-
professional and business services (-400)
-
manufacturing (-200)
New York City’s private sector job count increased over the past year by 64,000, or 1.5%, to 4,219,200 in July 2026. The largest employment gains occurred in these sectors:
-
education and health services (+43,900)
-
professional and business services (+15,200)
-
financial activities (+5,000)
-
other services (+3,900)
-
information (+1,300)
The following sectors experienced job losses over the past year:
-
natural resources, mining and construction (-3,400)
-
manufacturing (-1,800)
-
trade, transportation and utilities (-700)
The number of private sector jobs in the North Country region declined over the past year by 700, or 0.6%, to 112,200 in July 2026. Job gains were largest in the following sector:
-
education and health services (+400)
Employment losses were greatest in the following sectors:
-
trade, transportation and utilities (-700)
-
information (-200)
-
professional and business services (-200)
For the 12-month period ending July 2026, the number of private sector jobs in the Southern Tier decreased by 700, or 0.3%, to 208,100. Employment gains occurred in the following sectors:
-
education and health services (+1,200)
-
natural resources, mining and construction (+200)
Job losses occurred in the following sectors:
-
professional and business services (-600)
-
leisure and hospitality (-500)
-
manufacturing (-300)
-
trade, transportation and utilities (-300)
-
financial activities (-200)
-
information (-200)
Over the past 12 months, the number of private sector jobs in the Buffalo-Cheektowaga metro area increased by 2,800, or 0.6%, to 472,800 in July 2026. The largest over-the-year job gains occurred in the following sectors:
-
leisure and hospitality (+2,000)
-
education and health services (+1,300)
-
other services (+600)
-
natural resources, mining and construction (+200)
Employment losses occurred in the following sectors:
-
financial activities (-700)
-
manufacturing (-300)
-
information (-200)
-
trade, transportation and utilities (-200)
|
|
|
Click the button below to become a subscriber to Employment in New York State
Deputy Director / Editor
Kevin Jack
Associate Editors
|
Kevin Phelps
|
|
Steven Koczak
|
Editorial Advisor
Samantha Murray
|
|
|
|
|