|
 by Steven Koczak, PhD, Research Specialist
Like the famous 1970s advertising campaign for Trident sugarless gum, "four out of five economists" agree that when it comes to getting people to click on news stories about economics, cool shapes make for good clicks. Sometimes, economic trends are expressed as letters of the alphabet: “L” for an economy that drops quickly and evens out at a new, lower level, “V” for an economy that drops and recovers quickly, and “W” for a “double dip” recession.
One Arm Up, the Other Down
All of these letters refer to the overall path of “marquee” economic indicators, like the nonfarm job count, over time. Currently, the “K-shaped economy” is in vogue. It is used to highlight diverging economic fates, with some groups on an upward trajectory (the upward-pointing “arm”) and others on a downward trajectory (the downward-pointing “arm”).
Put simply, “K-shaped” describes a kind of economic inequality. The point is to describe an economy that’s behaving opposite to a traditional “bell curve” distribution, where most observations are located near the middle. In a K-shaped economy, most observations are pushed out toward the extremes, leaving gaps between industries, income groups and even generations.
An Associated Press article from 2025 is especially insightful: “A big reason the term [K-shaped economy] is popping up so often is that it helps explain an unusually muddy and convoluted period for the U.S. economy. Growth appears solid, yet hiring is sluggish and the unemployment rate has ticked up. Overall consumer spending is still rising, but Americans are less confident. AI-related data center construction is soaring while factories are laying off workers and home sales are weak. And the stock market still hovers near record highs even as wage growth is slowing.”
It Seemed Like a Nice Letter…
“K” may seem like a nice alternative to an “L-shaped” downturn, but the presence of a K-shaped economy is generally considered a problem by economists.
Economist Peter Atwater of the College of William & Mary invented the term to describe the economy after the COVID-19 shock. However, a K-shaped economy is propped up by spending from those in the upward-pointing arm of the K, which means trouble for all if they pull back. This danger was highlighted by two analysts in a paper published by the Federal Reserve Bank of Boston. The analysts found that “since 2022, spending by higher-income consumers has remained resilient and has been driving the growth in aggregate spending.”
What Does a “K” Look Like?
Various metrics — including consumer confidence, spending patterns and wealth distribution —have been used to measure the existence and extent of a K-shaped economy at the national level. Of all the usual indicators, stock ownership is the clearest evidence of a K-shaped economy.
The top 10% of income earners hold roughly 90% of the total stock value. Since April 2020, the U.S. stock market has experienced a significant, sustained bull run. As of early March 2026, the S&P 500 had risen roughly 133% from its post-recession levels in late April 2020. In contrast, lower-income consumers — including low-wage service workers and workers with unstable hours or “gig” roles — have been buffeted by sluggish wage growth and inflation, and tend to be on the downward-pointing arm of the K.
The K-shaped economy is also seen in the business world as well. Stock share prices for the companies competing to build out AI Infrastructure (data centers) — often referred to as the “Magnificent 7” — accounted for 52% of the gains in the S&P 500 stock market index in 2025. However, that rapid growth hasn’t translated into creating jobs or lifting incomes for those with limited stock exposure.
Agreement that the U.S. is in a K-shaped economy is not universal among analysts. A recent article in Bloomberg highlighted the points of contention. But if the U.S. is in the midst of such an economy, do state-level data reflect it? Is there a “K” in New York?
What Do PUMS Data Say?
To see whether New York has a K-shaped economy, three data sources were analyzed: the Census Bureau’s American Community Survey Public Use Microdata Sample (PUMS), the Quarterly Census of Employment and Wages (QCEW) and the Gini Coefficient of Inequality (Gini).
In a K-shaped economy, we expect that lower-income workers will experience higher rates of unemployment, and vice versa. An examination of New York PUMS data for three separate years (2006, 2018 and 2024) had the following results:
- Those with incomes lower than 90% of the median income had the highest unemployment rates: 9.3% in 2006, 6.3% in 2018 and 6.6% in 2024.
- Those with incomes from 90% of the median through 110% of the median had an unemployment rate of 2.6% in 2006, 1.3% in 2018 and 1.7% in 2024.
- Those with incomes greater than 110% of the median had the lowest unemployment rates: 1.5% in 2006, 0.9% in 2018, and 1.2% in 2024.
A separate analysis using Pearson correlation coefficients found that occupational categories with the highest incomes also tended to have lower unemployment rates. Thus, both the median income and correlation analyses had results consistent with a K-shaped economy in New York State.
What Do QCEW Data Say?
An analysis of QCEW data for private sector businesses looked at the distribution of total wages over time paid to three industry groups: those that pay under 90%, from 90% through 110% and over 110% of New York State’s mean wage. (Note: Switching to QCEW data necessitated using mean wages.)
This analysis found that between 2010 and 2024:
- Total wages earned by employees in private sector industries paying more than 110% of the state’s average annual wage (AAW) increased by 470.9%
- Workers in industries paying 90-110% of the AAW saw total wages rise by 139.9%
- Those earning less than 90% of the AAW experienced a total gain of 77.8%
Put another way: the average increase in total wages made by those in top-paying industries was more than five times that of the lowest-paying industries.
An examination of the post-pandemic recovery of the aggregate wages for the aforementioned wage groups found the following:
- Employees in private sector industries paying more than 110% of the state’s AAW received 53.4% of the increase in total wages between 2020 and 2024. These industries were responsible for 27.8% of private sector employment in 2024.
- Workers in industries paying 90-110% of the AAW received 13.9% of the increase in aggregate private sector wages in 2020-24. In 2024, these industries encompassed 12.8% of private sector employment in NYS.
- Of the total wages recovered from 2020 through 2024, 32.8% were received by workers in industries that paid less than 90% of the private sector average wage. These earners encompassed 59.4% of employment in 2024.
What Do Gini Data Say?
The Gini Coefficient (“Gini”) is a measure of income inequality across population groups — a score of 0 represents perfect equality and 1 indicates perfect inequality. In 2024, New York had a rounded score of .52, the highest income inequality of any state in the country and 8% higher than the nation’s overall score of .48. New York’s score has been somewhat consistent going back to 2006, varying only from rounded figures of .50 to .52.
It is very likely that the primary cause of this is the presence of Wall Street in New York. The financial industry is characterized by a relatively small number of people making large amounts of money (see third article in this issue for further details). This is almost certainly enough to skew any average.
Closing Thoughts
The term “K-shaped economy” is used to describe a particular form of economic inequality which can have various toxic effects on the overall economy. Invoking the shape of the letter K is intended to highlight diverging economic fates rather than focus on an average outcome that fewer economic actors have. Using PUMS, QCEW and Gini data, we can see evidence of a K-shaped economy in New York State, but the picture is mixed. Some of the data can be understood as suggesting that the rate of rising inequality may have slowed in recent years. And other data can be understood to reflect the presence of Wall Street.
|
|
"The Finger Lakes region is the home of a vigorous and diverse education system."
by Kurt Meichtry, Economist, Finger Lakes region
The Finger Lakes region is the home of a vigorous and diverse education system ranging from world-famous research universities to specialized community colleges to innovative K-12 programs. In turn, the region’s robust Educational Services (NAICS 61) sector plays many important roles in the Finger Lakes, including driving the region's knowledge-based economy, educating the next generation of workers and supporting community vitality. Here, we take an in-depth look at Educational Services in the Finger Lakes region.
Export-oriented Anchor Sector
Educational and medical institutions — sometimes called “eds and meds” — often “anchor” regional economies. This is because they are typically large, permanent entities with deep ties to communities, providing stability, vast employment and local economic support through procurement and investment.
The concentration of Educational Services jobs in the Finger Lakes regional economy is about 2.3 times higher than the national average. In fact, Educational Services has the highest employment concentration of any major industry sector in the Finger Lakes region. This suggests that Educational Services is an export-oriented sector for the Finger Lakes. The sector, in turn, provides the region with a competitive edge for attracting investment, talented workers, students, researchers and funding from all over the country and world.
International students bolster this export orientation, representing nearly one-third of the enrollment of the University of Rochester (UR) and about one in ten at the Rochester Institute of Technology (RIT). In 2023-24, spending by the 135,000+ foreign students attending colleges and universities in New York State contributed $6.3 billion to the Empire State’s economy — including $269 million contributed by UR students alone. Beyond spending, international students are responsible for fueling innovation in STEM, founding startups, and enhancing productivity.
Large Regional Employer
According to the Quarterly Census of Employment and Wages (QCEW), the Educational Services sector employed just under 75,000 workers in the Finger Lakes region during the four-quarter period ending September 2025, including 30,800 in the private sector. For the same period, Educational Services employers paid out more than $5.2 billion in total wages, with average annual earnings of $69,900. This was more than $4,700 above the region’s all-industry average. Annual average wages in the sector have grown over time, rising by 17.3% between the four-quarter period ending September 2020 and the corresponding period in 2025.
Major Employers and Recent Developments
Major institutions anchor the Finger Lakes' Educational Services sector, ranking among the region’s largest employers. UR and UR Medicine top the list with over 39,000 workers in education, research and healthcare. UR supports 49,000 jobs and $9.2 billion in local output in Monroe County alone.
In 2025-26, UR launched seven new programs in artificial intelligence (AI), aerospace engineering and Latinx studies. It also earned National Cancer Institute designation, funded four trans-disciplinary research centers and secured a record $111 million in federal funding for its Laboratory for Laser Energetics (a 17% increase), advancing high-energy-density physics, fusion and optics partnerships.
RIT, which emphasizes STEM and experiential learning, utilized $105 million in sponsored funding to open a new research building in 2025 for high-speed computing, neuroscience and AI. RIT climbed to #88 in the 2026 U.S. News & World Report best colleges rankings and earned Forbes recognition as a top college for career launches, with graduates earning a median salary of $80,300 three years post-graduation.
Collaborations like the Wayne-Finger Lakes BOCES Regionalization Dashboard, launched in 2025, help districts share resources and address teacher turnover, strengthening the K-12 talent pipeline. Other notable players include Cornell University's AgriTech campus in Geneva (Ontario County), which drives agricultural innovation through research in plant sciences and food systems, supporting local farms and agribusinesses with cutting-edge technologies.
Several factors provide the Finger Lakes with its “educational edge.” One is the interplay between top research institutions, like UR and RIT, and key industry sectors, like healthcare and manufacturing. These collaborations help to build talent pipelines in areas such as engineering, software and life sciences. Strategic partnerships entered through the Finger Lakes Regional Economic Development Council also spur innovation.
These anchors enhance resilience and stability, especially in rural areas, boosting educational attainment and mobility. However, recurring challenges like teacher shortages and declining K-12 enrollment in some school districts persist. This has prompted initiatives to recruit diverse educators and expand online programs for underserved communities. Efforts, such as UR's scholarships for first-generation students and RIT's outreach to underrepresented groups in STEM, aim to broaden access and address regional disparities.
Continued Growth Expected
Industry projections from the NYS Department of Labor expect the region’s Educational Services sector will add 20,000 jobs between 2022 and 2032, an 18.6% increase and almost double the region's 10.2% overall projected growth. Demand for skilled educators, higher enrollment and AI-integrated programs are expected to help fuel this growth, with a large number of openings anticipated in job titles like registered nurses, software developers and teaching positions requiring advanced degrees.
Through strong education, job creation and creative programs, the Educational Services sector continues to fuel economic growth in the Finger Lakes, playing a pivotal role in driving regional prosperity in the years ahead.
|
|
 by Kevin Jack, Deputy Director
Editor’s note: Our “At A Glance” section of the newsletter typically features regional jobs data. However, due to the federal government shutdown, this information was not available when we went to press. In its place, we offer the short article below, which we hope you enjoy.
What are the highest-paying industries in New York State? The most comprehensive answer can be found in the Quarterly Census of Employment and Wages (QCEW), which is a complete count covering more than 95% of U.S. jobs. For this analysis, we examined private sector industries at the 4-digit NAICS level. Industries were required to have at least 2,000 workers, and pass our standard data confidentiality tests, to be included. We used annual average wage data from 2024 for three distinct regions:
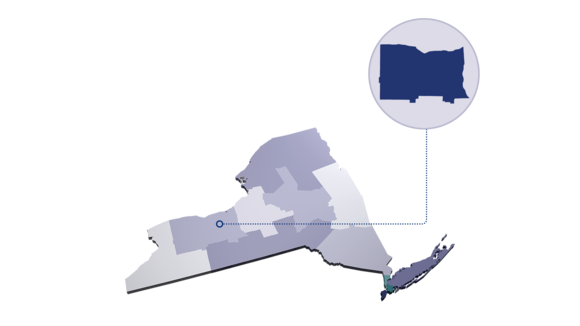
- New York City (the 5 boroughs)
- Downstate Suburbs (Nassau, Suffolk and Westchester counties)
- Balance of NYS (the remaining 54 counties)
The tables below show the 10 highest-wage industries in each of these three regions.
Private sector wages varied significantly across the state in 2024. For example, the overall annual average wage in New York City was $121,020 — almost twice as high as the average wage in Balance of NYS ($62,460). Wages in the Downstate Suburbs region fell in between at $79,720.
New York City
Five Finance sector industries (NAICS 52) and three Information sector (NAICS 51) industries dominated New York City’s Top 10 list. No surprise there, as New York City is widely recognized as a global financial center and as a global tech hub in which the Information sector (including streaming, software development, media and data) plays a pivotal role.
The third sector represented on NYC’s Top 10 list is Arts, Entertainment and Recreation (NAICS 71). New York City is home to many professional sports teams and several sports league headquarters, including MLB, NBA, NFL and NHL. The Independent Artists, Writers & Performers category includes individuals primarily engaged in creating original artistic works or performances.
Topping the wage heap in NYC was Other Financial Investment Activities (NAICS 5239), with an average wage of $515,600. This industry is a catch-all category that includes firms involved in providing investment advice, portfolio management, trust, fiduciary and custody activities.
Second was Securities & Commodity Contracts (NAICS 5231), at $499,200. It covers brokerage services, market making, investment banking and derivatives trading. With more than 100,000 workers, it was the largest employer on the NYC list.
The third highest-wage industry was Spectator Sports (NAICS 7112) at $457,600; some extremely high player salaries helped drive this result. For example, USA TODAY listed the New York Mets as having MLB’s highest payroll in 2024 at $306 million. The New York Yankees, with a payroll of $303 million, ranked #2 in the league.
Downstate Suburbs
The region’s highest-wage list has more sectors represented than on the NYC list. The best-represented were Finance with three industries and Information with two. Five other sectors had one industry each on the list.
This region had the same two top-wage industries as New York City — Other Financial Investment Activities at $522,100 and Securities & Commodity Contracts with an average wage of $322,000. The third wage spot went to the only manufacturing industry on the region’s list: Computer and Peripheral Equipment Mfg. (NAICS 3341), with an average annual wage of $289,200.
Also worthy of note is Management of Companies & Enterprises (NAICS 5511), which had the most employment (22,670) of any industry on the Downstate Suburbs list. This result reflects the fact that a number of major companies — including IBM, PepsiCo, Mastercard, Henry Schein, Northwell Health, Regeneron Pharmaceuticals and Danone North America — have their corporate headquarters in the region.
Balance of NYS
This region includes the remaining 54 counties in New York. Like the Downstate Suburbs region, it has more industry sectors represented on its high-wage list than on New York City’s list. Manufacturing (3), Finance (2) and Wholesale Trade (2) had the most industries on the list.
At $239,600, Securities & Commodity Contracts (NAICS 5231) was the highest-wage industry in the region. Interestingly, this was less than half of the same industry’s average ($499,200) in New York City, and about $80,000 less than its counterpart ($322,000) in the Downstate Suburbs region.
In second place was Spectator Sports (NAICS 7112) at $176,800. However, this wage level was less than 40% of the average wage for the same industry in New York City ($457,600).
Computer and Peripheral Equipment (NAICS 3341), third on the list, was the highest-paying manufacturing industry in the region. The average wage for this industry was $172,400 in 2024. The other two manufacturing industries on the Top 10 list included Pharmaceuticals & Medicine (NAICS 3254), with an average wage of $140,300, and Basic Chemicals (NAICS 3251), whose average wage was $118,700.
Also of note were two Wholesale Trade industries — Druggists' Goods (NAICS 4242) and Commercial Equipment Merchant Wholesale (NAICS 4234). Both industries had an average wage of around $119,000.
Summing Up
This analysis underscores the fact that a diverse set of industries paid the highest annual wages in the state. While the Finance and Information sectors paid the highest wages in New York City, the list of top-paying industries becomes more broad-based as you move to the Downstate Suburbs and Balance of NYS regions. Not surprisingly, average wages paid in New York City were significantly higher than those paid in the other two regions.
New York City: 10 Highest-Wage Industries, 2024
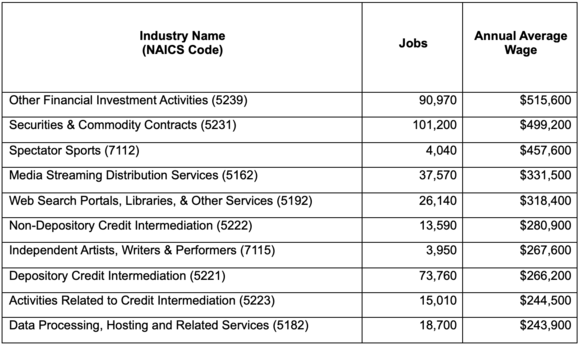 Source: QCEW
Downstate Suburbs: 10 Highest-Wage Industries, 2024
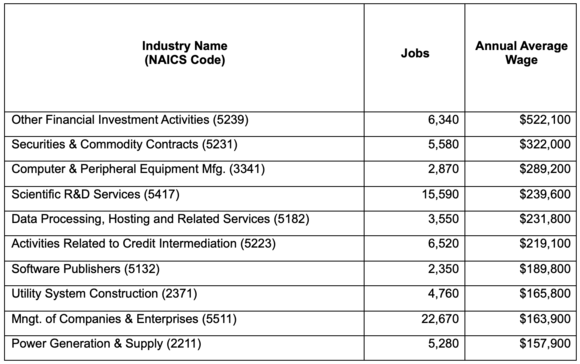 Source: QCEW
Balance of New York State: 10 Highest-Wage Industries, 2024
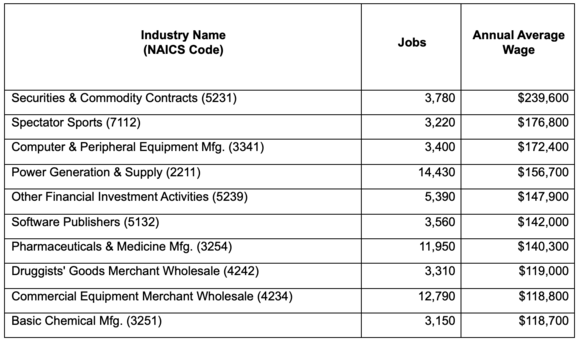 Source: QCEW
|
|
|
Click the button below to become a subscriber to Employment in New York State

|
|
|
|
|