|
 by Kevin Phelps, Principal Economist
“Stocks always go down faster than they go up, but they always go up more than they go down.”
David Gardner, investor and co-founder of “The Motley Fool”
This widely accepted stock market truism also applies to the overall national economy. In the short run, downturns tend to come on suddenly, but expansions tend to build gradually. However, over time the expansions tend to outweigh the contractions. As a result, over the long-term, the economy trends upward.
The Business Cycle
Fluctuations in economic activity are known as the “business cycle,” which has four principal stages:
-
Expansion: Characterized by increasing economic output, rising employment, higher consumption levels and growing consumer confidence.
-
Peak: The highest point in a business cycle, where the economy reaches maximum output, employment is high and inflationary pressures build, signaling the end of the expansion.
-
Contraction: A period of decline where economic activity slows, output falls, unemployment rises and demand decreases. Contractions that are severe, widespread and sustained may be deemed recessions.
-
Trough: The lowest point of a business cycle, characterized by higher unemployment, lower or negative inflation rates and tight credit conditions, signaling the end of a contraction.
One yardstick used to distinguish a mild contraction from a full-blown recession is the breadth of economic damage. The breadth depends in part on how closely different industry sectors (e.g., manufacturing, education) are tied to fluctuations in the underlying business cycle.
Put another way, not all industry sectors are created equal. Some are linked to the business cycle almost entirely (“cyclical sectors”), some far removed (“acyclical sectors”), and some (“counter-cyclical sectors”) serve as a counterpoint to the cycle (i.e., when the overall economy “zigs,” counter-cyclical sectors “zag”).
Sectoral Sensitivity
Every industry sector is different. Examples of highly sensitive sectors include those that primarily rely on discretionary spending (e.g., luxury goods producers, airlines, hotels and restaurants). Consumers tend to reduce or eliminate nonessential spending during economic downturns. Companies that operate in those sectors often respond with layoffs. During expansions, these same companies tend to hire workers at a faster pace than less sensitive sectors.
Examples of less sensitive sectors include those that produce or provide essential goods or services, such as healthcare, utilities, or government. Government may even be considered counter-cyclical in that it tends to ramp up hiring during contractions. Governments may increase spending on infrastructure and social services to boost demand. Downturns can increase demand for certain public services, ranging from social services to detailed and reliable economic data. Further, demand for certain public services (e.g., education or processing motor vehicle paperwork) is simply unrelated to business cycles.
Measuring Sensitivity
Here, we apply methods developed by economists at the Federal Reserve Bank-Dallas (FRB-D) to determine how sensitive employment levels in 34 New York State (NYS) industry sectors are to fluctuations in overall Total Nonfarm (TNF) employment in the state. In turn, we calculate a number to measure it, which we call a “sensitivity score.” Then, we sort and group the sectors by their sensitivity scores and calculate each group’s share of TNF.
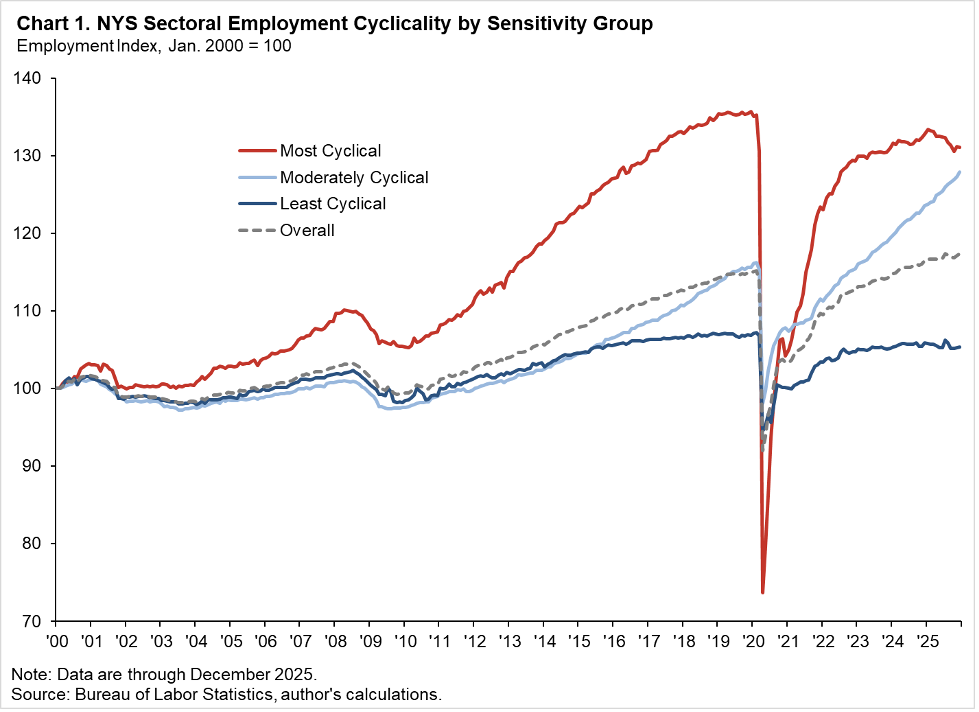
Sectors with a sensitivity score above 1.2 are considered the most cyclical. As shown below in Chart 1, staffing levels in these sectors rise and fall with the NYS business cycle but with more pronounced swings. Moderately cyclical sectors are those with a sensitivity score ranging from 0.8 to 1.2. Employment fluctuations in these sectors tend to match fluctuations in the overall NYS nonfarm employment level. Sectors with a sensitivity score below 0.8 are considered the least cyclical — these sectors either demonstrated weak co-movement with the business cycle, or were actually counter-cyclical, and tended to vary against the overall cycle.
 Share of Total Employment, by Cyclicality Category, NYS and U.S.
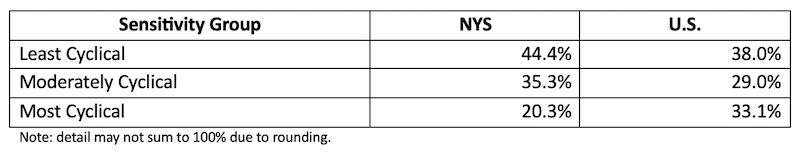 Employment is more evenly distributed among the three groups at the national level, with each group comprising roughly one-third of total employment. In contrast, roughly half of NYS jobs are in low-cyclical sensitivity sectors, one-third are in moderately sensitive sectors and one-fifth in highly sensitive sectors.
In Chart 2, we present NYS employment cyclical sensitivity scores by sector (with some mild aggregation) and compare them with the U.S.
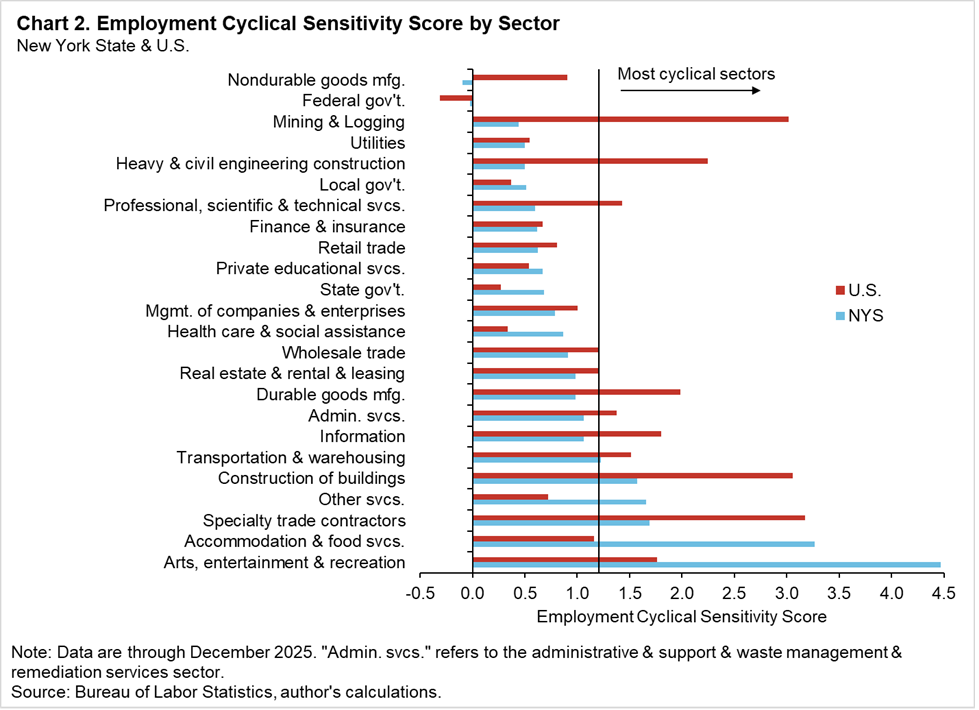 On the whole, NYS and the U.S. are similar in terms of cyclical sensitivity by sector. However, there are some notable distinctions. The Arts, Entertainment and Recreation and Accommodation and Food Services sectors are considerably more cyclical in New York than nationally. In contrast, NYS’s Mining and Logging and Heavy and Civil Engineering Construction sectors are significantly less sensitive to the business cycle than their national counterparts.
Conclusions
Our findings show that while NYS’s sectoral sensitivity profile largely mirrors that of the nation, key differences exist — most notably the elevated cyclicality of the Leisure and Hospitality component sectors and the relatively low sensitivity of Mining and Logging and Heavy and Civil Engineering Construction. These findings also show that relative to national trends, New York State’s overall employment base is less sensitive to fluctuations in the business cycle.
|
|
“The Mohawk Valley has long served as a corridor for travelers.”
by Brion Acton, Labor Market Analyst, Mohawk Valley region
Due to its central location, the Mohawk Valley has long served as a corridor for travelers journeying across the state. The earliest European explorers traveled up the Mohawk River. Later, starting in the 1820s, commerce and people moved along the Erie Canal. As automobile ownership boomed after World War II, scenic NYS Route 20 drew families on road trips. Today, millions of vehicles pass through the heart of the region via the New York State Thruway. While the means and motivation for travel have changed over time, the Mohawk Valley’s travel and tourism sector continues to adapt to the needs of visitors.
Recent Tourism Trends
The travel and tourism sector, which is comprised of a diverse set of related industries, has become a major driver of economic growth in the region. According to a series of regional reports released by consulting firm Tourism Economics under contract to Empire State Development, direct visitor expenditures in the Mohawk Valley in 2024 totaled more than $2.9 billion — up 6.1% from 2023’s level. Visitor spending generated $290 million in state and local taxes and supported over 24,200 local jobs. Lodging and Food & Beverage industries accounted for more than 60% of visitor expenditures in 2024.
Oneida and Otsego counties accounted for more than 85% of visitor spending in the six-county region. Oneida County, home to the Turning Stone Casino and Resort, Utica’s Adirondack Bank Center and Utica University Nexus Center, received over $2 billion in direct spending. Otsego County received an additional $420 million in visitor spending.
Projected Job Growth
The Leisure and Hospitality (L&H) industry group consists of two main components — Arts, Entertainment & Recreation and Accommodation & Food Services. This group accounts for about two-thirds of travel- and tourism-related jobs in the region. Moreover, two L&H industries were included in a list of the Mohawk Valley’s top 10 “Significant Industries” in a 2024 New York State Department of Labor (NYSDOL) report.
According to Quarterly Census of Employment and Wage data, the L&H industry group employed over 16,100 workers in the Mohawk Valley in 2024. This total includes 2,350 working in Arts, Entertainment & Recreation and 13,770 in Accommodation & Food Services.
Industry projections compiled by NYSDOL expect L&H employment will continue to grow. In 2022-32, job counts are expected to grow in both Arts, Entertainment & Recreation (+36.9%) and Accommodation & Food Services (+21.3%) at a rate more than twice the region’s overall average (+9.9%).
If You Build It, They Will Come
Located right off the NYS Thruway in Verona (Oneida County), the Turning Stone Resort Casino instantly became a destination when it opened in October 1993. Owned and operated by the Oneida Indian Nation, the casino helped to bring legal table gaming to New York State. It was expected to earn $100 million over its first year of operation. Just two years later, in 1995, it was one of the region’s top employers and, with just around four million visitors, one of New York State’s leading tourist destinations. Today, Turning Stone Enterprises boasts a $1 billion annual economic impact throughout its various business enterprises.
A multi-year expansion project called “Turning Stone Evolution,” which began in 2023, looks to grow the resort into New York State’s largest convention and events center. The largest expansion of the main casino property in 20 years will add more event space, two new hotels, a 1,500-space parking garage, more restaurants and amenities to the resort’s current facilities and world-class golf courses. In late 2025, Turning Stone officials announced that construction was running ahead of schedule and that hiring was underway for 350 new positions, adding to its current workforce of 5,000 employees.
Twenty miles east of Turning Stone, the City of Utica has emerged as a destination for regional, national and international sporting events. The renovated Adirondack Bank Center, home of the AHL's Utica Comets (hockey) and MASL's Utica City FC (soccer), has partnered with the Utica University Nexus Center to create a premier tournament facility.
Nexus has three NHL-sized hockey rinks that can be converted to turf for indoor lacrosse and soccer, a 1,200-seat arena and a direct walkway to the Adirondack Bank Center. Since opening in 2022, the facility has brought half a million visitors to the region annually generating $26 million in direct consumer spending.
Affectionately known as “America’s Hometown,” Cooperstown (Otsego County) has long welcomed guests from around the world. Visitors are drawn by such attractions as the Fenimore Art Museum, Otsego Lake, the Fenimore Farm and Country Village (the former Farmers’ Museum), the Glimmerglass Opera Festival and the National Baseball Hall of Fame and Museum, which hosted an estimated crowd of 30,000 visitors for the 2025 Hall of Fame induction.
Centered around Cooperstown and Oneonta, a premier hub for youth baseball participants has developed with three venues — Cooperstown Dreams Park, Cooperstown All-Star Village and Cooperstown Baseball World — offering week-long tournament-based camps for youth ages eight through 17. These camps bring in tens of thousands of visitors, who in turn support local lodging, restaurants, and retailers. Estimated summer spending averages $21 million per month, with a total annual economic impact of over $100 million.
Looking Ahead
Less than a five-hour drive from most major cities in the Northeast — including Toronto, Montreal, Ottawa, New York City, Boston and Philadelphia — the Mohawk Valley lies at the crossroads of Upstate New York. Given its key location, the Mohawk Valley is poised to continue to evolve as a destination for conventions, major sporting events and tournaments. In turn, this will bring billions of dollars in visitor spending into the region, which will help support future job creation.
|
|
 In December 2025, New York State’s seasonally adjusted private sector job count increased over the month by 16,000, or 0.2%, to 8,517,000. In addition, the state’s seasonally adjusted unemployment rate rose from 4.5% to 4.6% in December 2025, while New York’s seasonally adjusted labor force participation rate increased from 61.2% to 61.5%.
Capital
Over the past year, the Capital Region’s private sector job count rose by 1,900, or 0.4%, to 441,900 in December 2025. Employment gains occurred in the following sectors:
- education and health services (+3,500)
- professional and business services (+1,300)
- leisure and hospitality (+400)
Over-the-year job losses were largest in the following sectors:
- natural resources, mining and construction (-1,300)
- financial activities (-700)
- other services (-400)
- trade, transportation and utilities (-400)
- manufacturing (-300)
Central NY
The number of private sector jobs in the Syracuse metro area increased over the past year by 1,000, or 0.4%, to 262,500 in December 2025. Job gains occurred in these sectors:
- leisure and hospitality (+1,500)
- education and health services (+1,300)
- professional and business services (+1,300)
Job losses were largest in the following sectors:
- trade, transportation and utilities (-1,400)
- manufacturing (-600)
- natural resources, mining and construction (-400)
- financial activities (-300)
- other services (-300)
Finger Lakes
From December 2024 to December 2025, the number of private sector jobs in the Rochester metro area fell by 100, or less than 0.1%, to 444,000. Job gains occurred in the following sectors:
- education and health services (+2,500)
- professional and business services (+1,700)
- natural resources, mining and construction (+400)
Over-the-year job losses were greatest in the following sectors:
- leisure and hospitality (-2,000)
- manufacturing (-1,300)
- trade, transportation and utilities (-500)
- financial activities (-400)
- other services (-300)
Hudson Valley
Over the past year, the number of private sector jobs in the Hudson Valley grew by 1,900, or 0.2%, to 847,400 in December 2025. Job gains occurred in the following sectors:
- education and health services (+6,600)
- professional and business services (+1,900)
- financial activities (+500)
Job losses were largest in the following sectors:
- natural resources, mining and construction (-2,300)
- trade, transportation and utilities (-1,800)
- other services (-1,200)
- leisure and hospitality (-1,000)
- information (-500)
Long Island
From December 2024 to December 2025, private sector jobs on Long Island increased by 600, or 0.1%, to 1,177,800. Employment gains occurred in the following sectors:
- education and health services (+15,200)
- professional and business services (+2,600)
Over-the-year job losses were largest in the following sectors:
- natural resources, mining and construction (-6,300)
- leisure and hospitality (-4,100)
- financial activities (-3,000)
- trade, transportation and utilities (-1,500)
- other services (-1,400)
- information (-500)
Mohawk Valley
For the 12-month period ending December 2025, the number of private sector jobs in the Mohawk Valley region increased by 400, or 0.3%, to 142,100. The following sectors had the largest over-the-year employment gains:
- education and health services (+400)
- leisure and hospitality (+300)
Over-the-year job losses were centered in the following sectors:
- manufacturing (-300)
- other services (-200)
New York City
New York City’s private sector job count rose over the past year by 33,400, or 0.8%, to 4,332,300 in December 2025. Job gains occurred in the following sector:
- education and health services (+71,100)
Over-the-year job losses were largest in the following sectors:
- natural resources, mining and construction (-8,600)
- trade, transportation and utilities (-7,200)
- financial activities (-6,300)
- other services (-5,300)
- leisure and hospitality (-5,100)
- manufacturing (-2,400)
- professional and business services (-2,300)
North Country
The number of private sector jobs in the North Country region decreased over the past year by 400, or 0.4%, to 106,400 in December 2025. Over-the-year employment gains were largest in the following sectors:
- leisure and hospitality (+300)
- natural resources, mining and construction (+200)
Job losses were greatest in the following sectors:
- trade, transportation and utilities (-500)
- manufacturing (-400)
Southern Tier
For the 12-month period ending December 2025, the number of private sector jobs in the Southern Tier region increased by 500, or 0.2%, to 209,900. Employment gains occurred in the following sectors:
- education and health services (+1,400)
- leisure and hospitality (+800)
Job losses were centered in the following sectors:
- manufacturing (-1,100)
- financial activities (-300)
- other services (-200)
Western NY
Over the past 12 months, the number of private sector jobs in the Buffalo-Cheektowaga metro area rose by 3,500, or 0.7%, to 474,400 in December 2025. Over-the-year job gains occurred in the following sectors:
- education and health services (+3,700)
- professional and business services (+1,900)
- leisure and hospitality (+300)
These sectors experienced the largest over-the-year employment losses:
- natural resources, mining and construction (-1,100)
- manufacturing (-800)
- other services (-200)
- trade, transportation and utilities (-200)
|
|
|
Click the button below to become a subscriber to Employment in New York State

|
|
|
|
|