|
 by Kevin Jack, Deputy Director
“Diversification isn’t just an investing principle—it’s a risk management tool. And in times like these, that matters more than ever.”
Paul Niven, fund manager, F&C Investment Trust, 2025
The old farmers’ proverb "don't put all your eggs in one basket" first appeared in print in 1615 in the novel Don Quixote by the Spanish author Cervantes. Although more than 400 years have passed, it is just as applicable today as it was then.
Today, the phrase is often used in finance to refer to how investors should not place all their money in one asset class or a particular stock. For every wildly successful investment, there are many more duds that fizzle out, and what’s hot today may not be tomorrow. Who remembers prominent dot-com companies like Pets.com or Webvan that went bust after the dot-com bubble burst in 2000?
More recently, footwear designer and distributor Deckers Outdoor Corp., whose brands include UGG, Teva and Hoka, saw its stock price rocket 82% in 2024 then decline by more than 40% by the end of August 2025, making it one of the worst performers in the S&P 500. Wealth advisors suggest that, to avoid financial surprises, it’s best to build a diversified portfolio (aka “asset allocation”) with investments spread across multiple asset classes.
Data analytics firms have developed various metrics to measure how diversified a state, metro area or county economy is, based on its industry mix. Here, we review some of the advantages linked to economic diversification and then look at county economies in New York State.
Advantages of a Diversified Economy
Diversified local economies often offer several advantages relative to their less diversified counterparts. For example, a county whose employment base is concentrated in a few, fast-growing industries may experience rapid job growth, but it also becomes more vulnerable to downturns in the industries in which it specializes. Thus, more diversified economies may offer more stability as they are not tied to the fortunes of a single industry.
Economists at the Federal Reserve Bank of New York noted that “…diversity can be a spur to productivity and innovation, and…regions with a broad mix of industries possess a buffer against economic shocks that adversely affect individual industries.” Other economists note that more diverse economies often have lower unemployment rates and tend to experience less volatility in job growth over time.
Measuring Diversification
How do we measure the diversification of a local area’s economy? One common method is to compare the share of local employment in each of the area's industries with the nation's set of industries. Chmura, an economic software and consulting company headquartered in Richmond, Virginia, has developed a labor market research platform called JobsEQ. Chmura uses JobsEQ to calculate and assign an Economic Diversity Index (EDI) score to each state, metro area and county in the U.S.
The EDI is calculated by comparing the share of employment in each local industry (at the 6-digit NAICS level) with its corresponding share of employment in the U.S. The two employment shares are then subtracted from one another, and the absolute value is taken of the difference. This process is repeated for all 1,054 6-digit NAICS industries, and then the results are summed. The resulting value is the area’s EDI.
The interpretation of a local area’s EDI is straightforward:
- A relatively low EDI value means the local area’s employment shares across all industries are similar to the nation’s distribution of jobs, and the local area economy is considered “diverse”
- A relatively high EDI value means the local area’s employment shares across all industries are unlike the nation’s distribution of jobs, and the local area economy is considered “less diverse”
EDI Scores
Under the JobsEQ scoring system, the U.S. has the lowest EDI score, 0.00, as the nation’s economy is considered to be the most diverse. Among the 50 states in 2024, Texas is the most diversified with an EDI of 26.95. Alaska’s economy, with a score of 68.51, is the least diversified. New York State ranks in the middle of the pack at #29 with an EDI of 40.13, which places us behind Utah (39.94) and just ahead of Louisiana (40.42).
Switching to our nation’s 3,100+ counties, Maricopa County, Arizona, with a population of more than 4.4 million, or about 62% of that state's total, is the most economically diverse in the U.S. with an EDI score of 36.02. In contrast, Loving County, Texas, which is the least populated county in the U.S. with a population of just 64, is also the least economically diverse county in the U.S. with an EDI score of 190.44.
Four counties in New York State — Erie (#18), Suffolk (#59), Onondaga (#67) and Monroe (#85) — rank among the 100 most diversified counties in the country. In contrast, Hamilton County, which lies entirely within the Adirondack Park and is the most sparsely populated county in the eastern U.S., ranks #2896 in the nation with an EDI score of 137.28.
What makes Hamilton County’s EDI score so high? According to Alex Doherty, Managing Economist at Chmura Economics & Analytics, two industries are particularly influential. First, the local employment share (4.79%) for Hamilton County’s Recreational and Vacation Camps industry (NAICS 721214) is very high relative to the nation’s share (0.02%). This result makes sense as Hamilton County is heavily dependent on outdoor tourism activities. In contrast, Hamilton County has no employment in the General Medical and Surgical Hospitals industry (NAICS 622110), but this is a large industry at the national level with 3.86% of jobs.
County Diversification in NYS
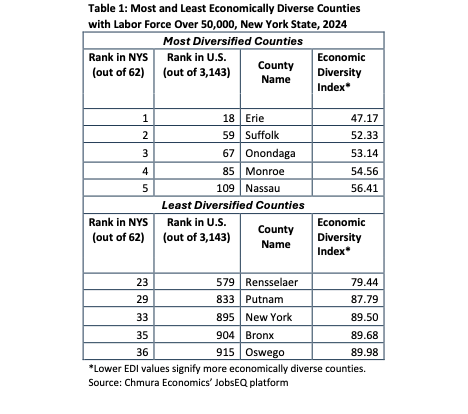
We now look at EDI scores for counties in New York State. For this analysis, the state’s 62 counties were split into two size classes — those with a labor force of over 50,000 (26) and those with a labor force under 50,000 (36). The tables at the end of this article show the most and least economically diverse counties within each size class in New York State in 2024, based on Chmura’s EDI values.
Larger Counties in NYS
Among the state’s 26 larger counties, the five that were the most diversified — Erie, Suffolk, Onondaga, Monroe and Nassau — were all found outside of New York City (NYC). Outside of NYC, the counties with the largest labor forces also have the lowest EDI scores (most diversified). The one exception is Westchester County — it has the third largest labor force among counties outside of NYC (behind Suffolk and Nassau) but ranked #6 in economic diversity among the larger counties.
There is a variety of county types among the five least diversified larger counties. This group included two counties in NYC (New York and Bronx), a Downstate suburban county (Putnam) and two Upstate counties — Rensselaer and Oswego — that are part of the Albany-Schenectady-Troy and Syracuse metropolitan areas, respectively.
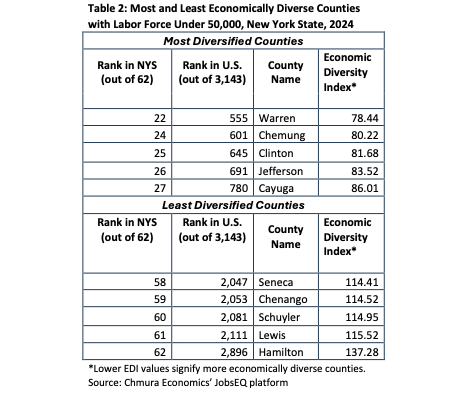
Smaller Counties in NYS
Among the five most diversified smaller counties (labor force under 50,000) in the state, three — Warren, Chemung and Jefferson — are part of a metropolitan area. Clinton County in the North Country region and Cayuga County in Central New York are both outside of metro areas and are thus classified as “minor counties.”
All five of the least diversified smaller counties are also minor counties. Three labor market regions are represented among them: North Country (Hamilton and Lewis counties), Southern Tier (Chenango and Schuyler counties) and Finger Lakes (Seneca County).
Advantages of Diversification
Do more diversified counties experience lower unemployment rates and less volatility in job growth over time? For the unemployment rate analysis, monthly labor force data from 2010-2024 were examined.
Among the larger counties, the five most diversified counties had a weighted unemployment rate of 5.4% over the 2010-2024 period, while the least diversified group of counties averaged 7.2% over this time frame.
Among smaller counties, the unemployment results were somewhat unexpected. The set of five most diversified counties had an unemployment rate (6.3%) that was actually slightly higher than the rate for the five less diversified counties (6.2%) in 2010-2024.
The last part of this county analysis compared the volatility in employment growth between the most diversified and least diversified counties in New York. Here, volatility is calculated as the average standard deviation of monthly five-year rolling windows.
Monthly Quarterly Census of Employment and Wages employment data from 2014-24 were used for this analysis. Interestingly, for both the larger and smaller groups of counties, the “most diversified” set of five counties in each group enjoyed job growth in 2014-24 that was only about 60% as volatile as their “least diversified” counterpart counties.
Summing Up
The diversification of a county’s industry mix can be measured relative to the nation’s mix. Chmura’s JobsEQ platform generates an EDI score for every state, metro area and county in the U.S.
Among larger counties in New York, the five most diversified counties had a lower group unemployment rate than the five least diversified counties. Among smaller counties, this advantage disappeared, and in fact diversified counties had a slightly higher unemployment rate than the less diversified counties.
Over the past decade, the most diversified counties in New York — both large and small — experienced lower volatility in employment growth than their least diversified counterparts. This result suggests that counties whose employment base is spread out across a wider selection of industries are less susceptible to boom and bust cycles.
To learn more about economic diversity and how it is measured by Chmura’s Economic Diversity Index, see https://www.chmura.com/blog/chmura-economic-diversity.
Author’s note: I wish to thank Alex Doherty, Managing Economist at Chmura Economics & Analytics, for providing the 2024 county economic diversity data used in this article.
|
|
“Restaurants have been a key contributor to the Hudson Valley’s vibrant tourism sector.”
by Johny Nelson, Labor Market Analyst, Hudson Valley region
It’s a fact of life: New Yorkers enjoy eating out. From 2014 to 2024, total spending by New Yorkers on food consumed away from home almost doubled, from $49.8 billion to $98.9 billion, per the U.S. Department of Agriculture. On a per capita basis, the average New Yorker’s spending jumped from $2,530 to $4,980 over this 10-year period!
The Hudson Valley region has been able to take advantage of this trend. Home to the world’s premier culinary college, the Culinary Institute of America in Hyde Park (Dutchess County), the region’s vibrant restaurant scene has helped to make the Hudson Valley a popular tourist destination. Figures compiled by Tourism Economics for Empire State Development indicate that visitor spending in the region increased by 8.8% to $7.4 billion in 2024, with food and beverage sales accounting for over one-quarter, or $2.1 billion, of overall visitor spending.
Clearly, restaurants have been a key contributor to the Hudson Valley’s vibrant tourism sector and recent growth in the region’s economy. Here, we focus on recent developments and trends affecting the region’s restaurant sector.
Employment Trends
In 2024, the Hudson Valley’s restaurant sector (NAICS 7225) consisted of over 5,000 establishments employing 56,300 workers. The sector accounted for about 7% of private sector jobs in the region and paid out $1.8 billion in wages. The sector is relatively low paying with an average annual wage of $31,400 due to part-time and seasonal work. However, sector pay rates have consistently increased over the past decade.
The region’s restaurant sector is expected to grow over the decade. Long-term industry projections from the New York State Department of Labor expect the job count in food services and drinking places to grow by 18.4% in 2022-32.
Restaurant Sector Developments
Since shedding over 20% of its workforce in 2020, the region’s restaurant sector has fully recovered from the pandemic. Recently, a wave of new restaurants opened across the region — from French bistros such as Bistrot le Chat Barbu in Rosendale (Ulster County) to such inventive concepts as New York Chicken Shop in Kingston (Ulster County) and Carlitos Tequileria in West Nyack (Rockland County). A key theme has been the creation of an immersive culinary experience which blends cross-cultural flavors, from French to farm-to-table American cuisine.
Sector Challenges
One ongoing issue facing the sector is labor shortages. The National Restaurant Association (NRA) reports that 62% of restaurant operators in the U.S. lack sufficient staff to meet customer demand. Locally, large institutions, like the Mohonk Mountain House in New Paltz (Ulster County), held job fairs well into 2025 to fill vacancies. This issue is particularly problematic in an industry that emphasizes timely and courteous service.
On the demand side, spending on meals consumed outside the home in the U.S. has slowed in 2025 as the restaurant sector grapples with the combined effects of poor consumer confidence and smaller consumer budgets. On the supply side, restaurants face rising food costs and supply chain disruptions. Rising tariff rates — which the NRA estimates could cost U.S. restaurants over $12 billion — will exacerbate these issues and add to sector uncertainty.
The restaurant sector is at a critical juncture as it integrates modern technology with innovations that enhance operational efficiencies while delivering a superior overall customer experience. Online ordering systems, contactless payment solutions and artificial intelligence (AI) are key technologies reshaping the restaurant industry. Online food delivery apps like Uber Eats and DoorDash have become increasingly popular. According to CloudKitchens, a company that operates ghost kitchens and develops other related technologies, the online food ordering industry in the U.S. was valued at an estimated $350 billion in 2024 and is projected to reach $500 billion by 2029.
Help from NYS
New York State has introduced policies and initiatives to support the Empire State’s restaurant sector. These include streamlining the application process for granting licenses and permits more quickly, which facilitates faster business openings and approvals of licenses to operate outdoor dining venues. Additionally, the state offers various financial aid programs to help restaurants cover operating costs during challenging times. One example is the Restaurant Resiliency Program, a $25 million initiative that provides funding to restaurants that choose to provide meals and food to people within distressed or underrepresented communities.
Summing Up
Restaurants occupy an important place within the tourism sector as well as in the broader economy. The Hudson Valley’s restaurant sector has performed well in recent years, recouping all of the jobs lost during the pandemic. However, like their counterparts across the nation, the region’s restaurateurs face a number of economic and technology headwinds noted above. Nonetheless, despite these challenges, the Hudson Valley's restaurant sector will continue to evolve going forward.
|
|
 In July 2025, New York State’s seasonally adjusted private sector job count increased over the month by 11,400, or 0.1%, to 8,479,400. In addition, the state’s seasonally adjusted unemployment rate held steady at 4.0% in July 2025, while New York’s seasonally adjusted labor force participation rate also held steady at 60.9%.
Capital
Over the past year, the private sector job count in the Capital Region rose by 3,200, or 0.7%, to 449,400 in July 2025. The following sectors experienced employment gains:
- education and health services (+2,600)
- professional and business services (+1,500)
- natural resources, mining and construction (+300)
- leisure and hospitality (+200)
Over-the-year job losses were largest in the following sectors:
- information (-400)
- manufacturing (-400)
- trade, transportation and utilities (-300)
Central NY
The number of private sector jobs in the Syracuse metro area increased over the past year by 8,100, or 3.2%, to 264,600 in July 2025. Job gains occurred in these sectors:
- education and health services (+3,000)
- leisure and hospitality (+2,600)
- professional and business services (+1,400)
- trade, transportation and utilities (+1,200)
- natural resources, mining and construction (+500)
Losses were centered in the following sector:
Finger Lakes
From July 2024 to July 2025, the number of private sector jobs in the Rochester metro area increased by 3,900, or 0.9%, to 444,100. The largest employment gains occurred in these sectors:
- education and health services (+2,200)
- professional and business services (+1,200)
- natural resources, mining and construction (+800)
- leisure and hospitality (+500)
Over-the-year job losses occurred in the following sectors:
- manufacturing (-500)
- financial activities (-300)
- information (-200)
Hudson Valley
Over the past year, the number of private sector jobs in the Hudson Valley grew by 11,400, or 1.4%, to 850,600 in July 2025. The largest job gains were found in the following sectors:
- education and health services (+6,300)
- leisure and hospitality (+3,000)
- professional and business services (+1,300)
- other services (+900)
- financial activities (+500)
- trade, transportation and utilities (+500)
Job losses occurred in the following sectors:
- natural resources, mining and construction (-800)
- information (-700)
Long Island
From July 2024 to July 2025, the number of private sector jobs on Long Island increased by 5,400, or 0.5%, to 1,189,800. Employment gains were greatest in the following sectors:
- education and health services (+13,800)
- professional and business services (+2,300)
- other services (+500)
Over-the-year job losses were largest in the following sectors:
- trade, transportation and utilities (-4,600)
- natural resources, mining and construction (-3,400)
- financial activities (-1,900)
- leisure and hospitality (-800)
Mohawk Valley
For the 12-month period ending July 2025, the number of private sector jobs in the Mohawk Valley region increased by 2,300, or 1.6%, to 144,400. These sectors had the largest over-the-year employment gains:
- education and health services (+1,800)
- leisure and hospitality (+500)
- trade, transportation and utilities (+500)
Over-the-year job losses were largest in the following sectors:
- manufacturing (-400)
- other services (-200)
New York City
New York City’s private sector job count rose over the past year by 92,000, or 2.2%, to 4,260,000 in July 2025. The largest job gains occurred in the following sectors:
- education and health services (+72,400)
- leisure and hospitality (+13,200)
- information (+6,700)
- trade, transportation and utilities (+2,700)
The greatest job losses occurred in the following sectors:
- natural resources, mining and construction (-2,000)
- other services (-600)
- professional and business services (-400)
North Country
Over the past year, the number of private sector jobs in the North Country region decreased by 1,200, or 1.1%, to 110,000 in July 2025. Minor gains occurred in two sectors.
Over-the-year job losses were greatest in the following sectors:
- trade, transportation and utilities (-600)
- manufacturing (-400)
Southern Tier
For the 12-month period ending July 2025, the number of private sector jobs in the Southern Tier region increased by 2,600, or 1.2%, to 211,600. Employment gains were largest in the following sectors:
- education and health services (+2,300)
- leisure and hospitality (+1,400)
- natural resources, mining and construction (+400)
Job losses were largest in the following sectors:
- manufacturing (-1,200)
- professional and business services (-200)
Western NY
Over the past 12 months, the number of private sector jobs in the Buffalo-Cheektowaga metro area rose by 8,800, or 1.9%, to 475,000 in July 2025. Over-the-year job gains were largest in the following sectors:
- education and health services (+5,800)
- leisure and hospitality (+2,100)
- trade, transportation and utilities (+1,200)
- professional and business services (+500)
- other services (+400)
This sector with the largest over-the-year employment loss was:
|
|
|
Click the button below to become a subscriber to Employment in New York State

|
|
|
|
|