|
 by Steven Koczak, PhD, Research Specialist
"We've always had heat waves. But it's happening a lot more, with greater intensity, greater duration and greater frequency."
Dr. Max Holmes, Woodwell Climate Research Center
It’s not just you. New York State is getting hotter. As scientists at the New York State Climate Impacts Assessment project highlighted: “Average and maximum temperatures have increased in New York State since the early 20th century and are projected to continue to rise throughout the 21st century.” Federal agencies cite the evidence for broader warming patterns here and here.
New York Responds
New York State agencies have responded to the increasing heat in various ways. For example, the Department of Health (DOH) maintains an extreme heat dashboard; the Department of Environmental Conservation (DEC) developed an extreme heat action plan and issued a report summarizing the effects of extreme heat and our state’s vulnerabilities to it; and the State Department of Labor (NYSDOL), working with the DEC, issued a booklet of guidance to employers regarding how to protect their employees from extreme heat.
Extreme Heat, Work and the Economy
The connection between extreme heat, the economy and the workforce has been explored by analysts going back more than 250 years. As the earth gets warmer, extreme temperatures occur more frequently, and these episodes of extreme heat can be deadly. The DEC indicated that, despite the lack of attention it gets relative to other disasters, extreme heat kills more people than any other weather-related hazard.
Cardiovascular strain, heat stress, skin damage, respiratory issues and dehydration can all result from working in extreme heat environments. Extreme heat can also induce psychological stress and anxiety. These effects have significant economic consequences. For example, a 2022 study highlighted in Barron’s found that “cumulative [economic] losses [due to extreme heat] from 1992 to 2013 likely fall between $16 trillion and $50 trillion globally.”
Common sense, data and various studies all underscore that the types of work most vulnerable to the effects of heat are anything that usually occurs outside or that’s inside but is impossible or too expensive to air condition. A 2021 study published in the journal Climatic Change by researchers Yuqiang Zhang at Duke University and Drew Shindell at Tel Aviv University (Z&S) identified the industry sectors most vulnerable to heat:
- Agriculture (NAICS 11)
- Mining (NAICS 21)
- Utilities (NAICS 22)
- Construction (NAICS 23)
- Manufacturing (NAICS 31-33)
- Transportation (NAICS 48-49)
Extreme Heat and State Economies
Of course, extreme heat varies by geography, and therefore so does its economic impact. While this principle mostly applies globally, it also can be applied, to a lesser degree, to examine individual U.S. states and their economies. Z&S measured potential labor losses due to extreme heat on a state-by-state basis, then extrapolated these losses for two future periods: 2020-2050 and 2020-2100.
Unsurprisingly, the state with the greatest potential for labor and economic losses due to extreme heat, in absolute dollar terms, was Texas, which had the second largest state GDP ($2.58 trillion) in 2023. It is already a very hot state, with a large economy and population (hence a lot of labor and economic activity potentially to lose to heat). A separate analysis from the Dallas Federal Reserve found that for every 1-degree increase in average summer temperature, growth in Texas’s annual nominal GDP slowed by 0.4 percentage points.
California ranked second in potential labor losses from extreme heat. With a GDP of $3.87 trillion in 2023, California has by far the largest state economy. In addition, California is a very long state (north to south) with a lot of hot weather in parts of it.
Arizona, a smaller economy but with a very hot environment, came in #3 in potential losses, with Florida ranked #4.
Extreme Heat and the NYS Economy
New York has a large, diversified economy, ranking #3 in terms of overall state GDP ($2.17 trillion) in 2023. Until recently, the state was consistently blessed with relatively moderate temperatures. While our state’s potential losses from extreme heat were found to be smaller than those of other, larger states, we still ranked #5 on this metric.
As discussed in the May 2025 issue of this newsletter, the U.S. Census Bureau compiles and publishes “Community Resilience Estimates” (CRE). These data detail the vulnerability of individual U.S. counties to various types of disasters, such as earthquakes, flooding and hurricanes. These vulnerabilities in turn are based on the percentage of people in the county possessing a certain number of components (zero, one or two, or three or more) of vulnerability (e.g., communication barriers, lack of health insurance, age 65+, etc.). There are a total of 10 components of vulnerability in the CRE system.
The CRE maintains data on certain heat-specific metrics by county as well:
- How many consecutive days a given county had a temperature of 90+ degrees
- A county’s maximum recorded “wet bulb temperature” in 2022 (a commonly used measure of heat stress in direct sunlight)
- Whether or not a county qualified for a “heat event” designation (meaning the county had maximum air temperature of 90+ for two consecutive days and a maximum wet bulb temperature of 80 or more at any point during the year)
There were 20 counties in New York State that met “heat event” criteria in 2022: Albany, Bronx, Chautauqua, Dutchess, Erie, Jefferson, Kings, New York, Niagara, Onondaga, Ontario, Orleans, Oswego, Putnam, Queens, Rockland, Schenectady, Seneca, Wayne and Westchester.
These “heat event” counties represented roughly one-third of New York State’s 62 counties. Three counties in New York City — #1 Bronx, #2 New York (Manhattan) and #5 Kings (Brooklyn) — were also among the top five New York State counties with the highest percentage share of their population possessing 3+ components of vulnerability. Rounding out the top five statewide list were two Upstate counties: #3 Hamilton and #4 Yates.
The 20 counties in New York State that met the heat event criteria had a combined current-dollar GDP of about $1.65 trillion in 2023 (the most-recent year available). This group represented more than 75% of New York’s statewide GDP of $2.17 trillion and included seven of the state’s 10 largest counties (based on GDP).
Another way to gauge the effect of extreme heat on New York’s economy is to examine the share of the statewide labor force residing in counties that met the heat event criteria. These counties had a combined labor force of just under 6.2 million in 2023, or about 63% of the statewide total labor force of 9.8 million that year.
Data from the Quarterly Census of Employment and Wages (QCEW) paint the clearest picture of employment and wages by industry sector and county. In 2023, there were more than 640,000 private sector jobs in the six sectors most impacted by heat (see list above) located within the 20 heat-prone counties in New York State identified in the CRE. Those employees earned combined wages of over $52.5 billion, and their average annual wage topped $82,000.
Coping With Extreme Heat at Work
As noted above, NYSDOL produced guidance for employers to keep their employees safe during extreme heat. Here is a sample of their recommendations:
- Outdoor employees should be provided with 32 ounces of cool drinking water per hour and should be afforded time to drink it
- Employers should provide shade and paid rest
- Employers should “institute standardized rest breaks, adjusted based on how strenuous work activities are” and the rest schedule should be in writing
- Employers should provide appropriate protective equipment, such as sweat-wicking garments, cooling vests, wide-brim hats, sunscreen and so forth
Conclusions
At the end of July 2025, New Yorkers were urged to prepare for a multi-day stretch of high outdoor temperatures. This heat wave featured “feels-like” temperatures ranging from the low 90s to over 100 degrees. Clearly, this will not be the last time.
The economic ramifications of extreme heat can be demonstrated using data, just like the health impacts can. Even if the worst projected economic consequences do not come to pass, we can already see the short-term effects. This is especially concerning when considering that New York City, the economic powerhouse of the Empire State, is also the region most subject to and most vulnerable to extreme heat.
|
|
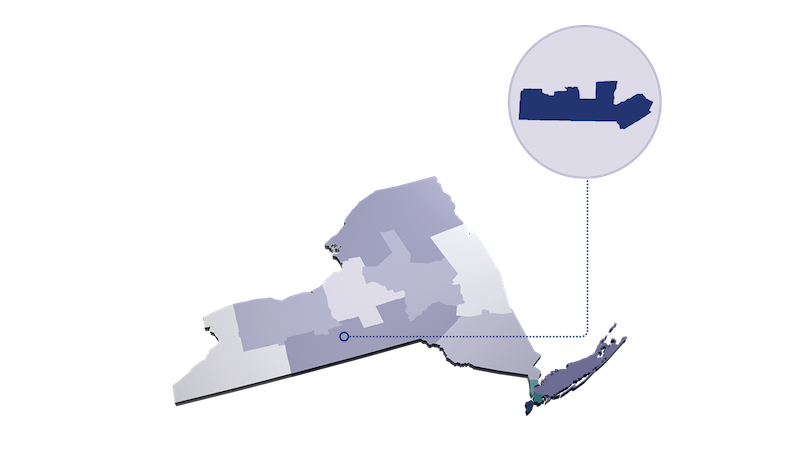
“Between 2022 and 2032, employment in the Southern Tier regional economy is expected to grow by nearly 28,000.”
by Christian Harris, Labor Market Analyst, Southern Tier region
The New York State Department of Labor’s Division of Policy, Strategy and Research (PS&R) compiles and publishes long-term occupational employment projections for New York State and its ten labor market regions every two years. These data, which cover a 10-year period, are updated and revised to incorporate economic changes stemming from industry growth, technological changes and other factors that occur in the state and local regions.
On July 1, 2025, PS&R released new long-term projections, which span the 2022-32 period. Projections are widely used by workforce planners, training providers, jobseekers, and educators for planning and preparing educational and training programs, developing career information, and studying long-range occupational employment trends. This article explores some data highlights for the Southern Tier.
Overview
Between 2022 and 2032, employment in the Southern Tier regional economy is expected to grow by nearly 28,000, or 10.4%. Perhaps even more impressive is the fact that the region is projected to average 33,800 job openings per year. Over the entire 10-year time horizon, this amounts to a total of around 338,000 job openings in the region.
The balance of this article focuses on the five occupational clusters, referred to in the Standard Occupational Classification (SOC) system as “major groups,” in the Southern Tier that are expected to add the most jobs in 2022-32. Occupational clusters reported here are organized by SOC code.
Educational Instruction & Library Jobs (SOC 25)
Jobs in the region’s educational instruction and library major group are expected to experience the largest net growth in 2022-32. This result comes as no surprise, as the Southern Tier is home to 64 local school districts, four Boards of Cooperative Educational Services (BOCES) and nine colleges and universities. Cornell University in Ithaca and Binghamton University are two of the region’s largest employers, with each providing a substantial local economic impact — $5.6 billion and $1.5 billion, respectively.
Employment in this major group was over 25,000 in 2022, a figure that is expected to grow by over 5,000 by 2032. Individual job titles expected to experience the largest net growth in 2022-32 include:
- Teaching assistants, except postsecondary (+800)
- Elementary school teachers, except special education (+610)
- Secondary school teachers, except special and career/technical education (+400)
- Substitute teachers, short-term (+330)
- Middle school teachers, except special and career/technical education (+220)
- Instructional coordinators (+220)
Healthcare (SOC 29 & SOC 31)
Healthcare practitioners and technical occupations (SOC 29) and healthcare support (SOC 31) represent two of the largest-growing major groups. The region’s healthcare sector has been one of the most consistent growers, adding jobs almost every year. This trend is projected to continue. Some of the largest healthcare employers in the region are United Health Services, Guthrie and Centralus Health, which is an affiliation of Elmira-based Arnot Health and Cayuga Health in Ithaca.
In 2022, there were nearly 28,000 people working in these two healthcare major groups in the Southern Tier. Over 7,100 healthcare jobs are expected to be added in the region through 2032. Specific titles projected to add the most jobs are:
- Home health and personal care aides (+1,880)
- Registered nurses (+1,390)
- Nursing assistants (+720)
- Nurse practitioners (+350)
- Licensed practical and licensed vocational nurses (+300)
Office & Administrative Support (SOC 43)
Office and administrative support jobs are found in nearly every business setting. In 2022, there were over 33,000 people employed in this major group. The job count in this category is projected to grow by over 3,700 in 2022-32. Job titles adding the most workers in this major group include:
- Secretaries and administrative assistants, except legal, medical, and executive (+540)
- First-line supervisors of office and administrative support workers (+320)
- Executive secretaries and executive administrative assistants (+250)
- Receptionists and information clerks (+160)
- Customer service representatives (+150)
Food Preparation & Serving Related (SOC 35)
The job count in this category is expected to grow from 21,580 in 2022 to 25,190 in 2032—an increase of 3,610. The bulk of these workers are employed in the Southern Tier region’s 1,000+ restaurants. Specific occupations in this major group that are projected to grow the most through 2032 include:
- Fast food and counter workers (+1,150)
- Cooks, restaurant (+550)
- First-line supervisors of food preparation and serving workers (+360)
- Waiters and waitresses (+360)
- Dining room and cafeteria attendants and bartender helpers (+290)
Looking Ahead
Many occupations in the Southern Tier region are expected to grow between 2022 and 2032. Net job growth is expected to be greatest in the five occupational categories, “major groups” in SOC terminology, discussed here. To learn more about the Southern Tier’s regional labor market, see https://dol.ny.gov/labor-statistics-southern-tier-region. For additional information about long-term occupational employment projections, visit https://dol.ny.gov/employment-projections.
|
|
 In June 2025, New York State’s seasonally adjusted private sector job count increased over the month by 6,500, or 0.1%, to 8,471,900. In addition, the state’s seasonally adjusted unemployment rate held steady at 4.0% in June 2025, while New York’s seasonally adjusted labor force participation rate fell from 61.0% to 60.9%.
Capital
Over the past year, the private sector job count in the Capital Region rose by 1,900, or 0.4%, to 447,700 in June 2025. Employment gains occurred in the following sectors:
- professional and business services (+2,100)
- natural resources, mining and construction (+800)
- trade, transportation and utilities (+700)
- education and health services (+500)
Over-the-year job losses were greatest in the following sectors:
- manufacturing (-900)
- leisure and hospitality (-800)
- other services (-300)
- information (-200)
Central NY
The number of private sector jobs in the Syracuse metro area increased over the past year by 7,300, or 2.8%, to 263,800 in June 2025. The largest job gains occurred in these sectors:
- leisure and hospitality (+2,400)
- education and health services (+1,800)
- professional and business services (+1,600)
- trade, transportation and utilities (+1,300)
- natural resources, mining and construction (+600)
The largest job loss occurred in the following sector:
Finger Lakes
From June 2024 to June 2025, the number of private sector jobs in the Rochester metro area held steady at 444,600. The largest job gains occurred in the following sectors:
- professional and business services (+900)
- natural resources, mining and construction (+700)
- leisure and hospitality (+200)
Over-the-year job losses occurred in the following sectors:
- trade, transportation and utilities (-600)
- other services (-400)
- financial activities (-300)
- information (-300)
- manufacturing (-300)
Hudson Valley
Over the past year, the number of private sector jobs in the Hudson Valley grew by 5,700, or 0.7%, to 846,000 in June 2025. Job gains occurred in the following sectors:
- education and health services (+4,000)
- leisure and hospitality (+2,500)
- professional and business services (+900)
- financial activities (+600)
- manufacturing (+300)
Over-the-year employment losses occurred in the following sectors:
- natural resources, mining and construction (-1,600)
- information (-600)
- other services (-200)
- trade, transportation and utilities (-200)
Long Island
From June 2024 to June 2025, the number of private sector jobs on Long Island increased by 4,400, or 0.4%, to 1,190,300. Employment gains occurred in the following sectors:
- education and health services (+17,100)
- professional and business services (+300)
Over-the-year job losses were largest in the following sectors:
- leisure and hospitality (-4,200)
- natural resources, mining and construction (-4,000)
- trade, transportation and utilities (-1,800)
- financial activities (-1,400)
- information (-900)
Mohawk Valley
For the 12-month period ending June 2025, the number of private sector jobs in the Mohawk Valley increased by 1,000, or 0.7%, to 143,500. The following sectors had the largest over-the-year employment gains:
- education and health services (+1,200)
- trade, transportation and utilities (+500)
- leisure and hospitality (+200)
- natural resources, mining and construction (+200)
Over-the-year job losses were centered in the following sectors:
- manufacturing (-500)
- professional and business services (-400)
- other services (-300)
New York City
New York City’s private sector job count rose over the past year by 73,700, or 1.8%, to 4,275,500 in June 2025. Job gains occurred in the following sectors:
- education and health services (+68,000)
- information (+8,500)
- leisure and hospitality (+2,200)
- financial activities (+900)
Over-the-year employment losses were largest in the following sectors:
- natural resources, mining and construction (-3,500)
- trade, transportation and utilities (-800)
- manufacturing (-700)
- other services (-700)
North Country
From June 2024 to June 2025, the number of private sector jobs in the North Country region decreased by 900, or 0.8%, to 109,300 in June 2025. Several sectors experienced small employment gains over the past year.
Employment losses were greatest in the following sectors:
- trade, transportation and utilities (-400)
- manufacturing (-300)
- natural resources, mining and construction (-200)
- other services (-200)
Southern Tier
For the 12-month period ending June 2025, the number of private sector jobs in the Southern Tier increased by 1,900, or 0.9%, to 210,800. Employment gains occurred in the following sectors:
- education and health services (+3,100)
- leisure and hospitality (+500)
- natural resources, mining and construction (+300)
The greatest over-the-year employment losses occurred in the following sectors:
- manufacturing (-1,200)
- professional and business services (-300)
- trade, transportation and utilities (-300)
Western NY
Over the past 12 months, the number of private sector jobs in the Buffalo-Cheektowaga metro area rose by 2,600, or 0.5%, to 475,900 in June 2025. Over-the-year job gains occurred in the following sectors:
- education and health services (+4,000)
- leisure and hospitality (+500)
- trade, transportation and utilities (+400)
Sectors experiencing the largest over-the-year employment losses included:
- manufacturing (-1,200)
- financial activities (-600)
- natural resources, mining and construction (-400)
|
|
|
Click the button below to become a subscriber to Employment in New York State

|
|
|
|
|