|
 “62% of Americans believe AI will have a major impact on workers generally, but only 28% believe it will have a major effect on them personally.”
Pew Research Center
by Kevin Jack, Deputy Director
The initial public release of the ChatGPT program by OpenAI in November 2022 captured the world’s attention and spurred much discussion about both the promise and possible perils of generative Artificial Intelligence (AI). Only a month later (December 2022), the Pew Research Center conducted a survey of more than 11,000 U.S. adults to learn their views on AI. Published in April 2023, the survey found that most people (62%) in the U.S. believe AI will have a major impact on jobholders in the next 20 years. However, far fewer (28%) think it will greatly affect them personally.
Technology Adoption Rates
An August 2024 survey from the Federal Reserve Bank of St. Louis (FRB-SL) found that almost 40% of the U.S. population aged 18-64 used AI to some degree. It also noted that 32% of respondents used it at least once in the prior week.
Almost two years after ChatGPT’s first public release, AI’s rate of adoption by the U.S. public already exceeded those of two other key technologies — the personal computer (PC) and the Internet. Three years after the initial release of IBM’s personal computer in August 1981, only 20% of the U.S. population was using that technology. Likewise, two years after the Internet became widely available to the public in April 1995, only about 20% of Americans were using it. According to the authors of the FRB-SL study, their key finding is that “generative AI use is widespread across gender, age, education, industries and occupations.”
Harvard Study
Given its relatively high adoption rate and widespread use, some fear negative employment impacts from the trend of growing AI adoption. Three Harvard University economists — David Deming, Christopher Ong and Lawrence Summers (DOS) — investigated this question in a research paper titled “Technological Disruption in the U.S. Labor Market,” published by the non-profit Aspen Economic Strategy Group in November 2024.
Occupational Churn over Time
The DOS team reviewed 140 years of U.S. economic history (1880-2020) to see how the introduction of past disruptive technologies, such as steam power and electricity, affected the American workforce. This change in the mix of occupations is called “occupational churn.” The DOS team noted two major shifts in the employment makeup of the American workforce. From 1880 to 1960, the nation’s farm sector experienced a significant drop in its overall share of U.S. employment, falling from about 40% to just over 5%.
A similar shift happened with blue-collar jobs in the U.S. From 1880-1960, blue-collar jobs as a share of U.S. employment held relatively constant at 40%. However, starting about 65 years ago, blue-collar workers in a diverse set of occupational categories began to transition into office jobs. This movement affected a variety of fields including manual labor, construction, production and manufacturing, transportation, and maintenance and repair.
As this transition occurred, blue-collar jobs dipped from 40% of U.S. employment in 1960 to 30% by 1980. After 1980, the share of U.S. workers employed in blue-collar jobs continued to fall, albeit at a slower rate, reaching 20% in 2010. These figures highlight the fact that occupational churn continues to occur in the U.S. economy.
However, the DOS study also uncovered an interesting point: that the pace of churn has actually slowed over time, with 1990-2017 being the most stable labor market period, going back to 1880. But the U.S. labor market has experienced rapid change again, during the post-pandemic era. A key question is whether this recent speed-up in occupational churn will continue.
It’s important to keep in mind that the finding for 1990-2017 is a relative thing. The key point is not that this labor market was particularly stable, but rather that the employment shifts occurring in the past were much greater. Thus, despite the rise of new technologies such as the PC, the Internet and the smartphone in recent decades, these innovations didn’t change how Americans work as much as the way earlier waves of technical breakthroughs did.
GPTs and Creative Destruction
The DOS paper cites steam power and electricity as examples of “general-purpose technologies,” or GPTs. They define GPTs as “widely used, capable of ongoing improvement, and enabling complementary innovation,” such as “the mechanization of farm work and the rise of manufacturing.” In the past, the introduction of GPTs created new occupations and destroyed some older ones. This process, known as “creative destruction,” was a term coined in the early 1940s by Harvard economist Joseph Schumpeter.
The study’s authors believe that AI could also prove to be a GPT “on the scale of prior disruptive innovations, with widespread and long-lasting impacts.” DOS underscore their argument by highlighting four recent U.S. labor trends that they say reflect the impact of technology, including:
- The U.S. labor market is no longer polarizing. From 2000 to 2016, employment in low- and middle-paid occupations declined, while highly paid employment grew. But “employment growth since 2016 looks more like skill upgrading than polarization.”
- Job growth has slowed in low-paid service sector jobs. "This decline had less to do with automation than with rising wages for lower-paid work and increased labor market tightness, though rising labor costs could spur automation at the lower end of the job market."
- The share of overall employment in science, technology, engineering and mathematics (STEM) jobs has increased by more than 50% since 2010, fueled by growth in software and computer-related occupations.
- Retail employment has declined by 25% over the last decade, probably because of technological improvements in online retail.
Summing Up
DOS draw two general conclusions from their review of past introductions of disruptive technologies. First, while technological breakthroughs often occur rapidly, their adoption is gradual, and the ensuing disruption of labor markets may take decades. Second, the introduction of GPTs often generates new occupational categories and makes others more productive.
Going forward, as certain “old” job categories take a hit from GPTs, like generative AI, policymakers will need to develop strategies to help displaced workers find new, rewarding work. DOS close their paper by noting: “At least in the near term, AI is more likely to ratchet up firms’ expectations of knowledge workers than it is to replace them. In that case, policy solutions such as increased public investment in STEM education and training and reskilling will be necessary to help workers adapt to and effectively use new technologies."
|
|
|
“The travel and tourism sector has evolved to become a cornerstone of the North Country’s economy.”
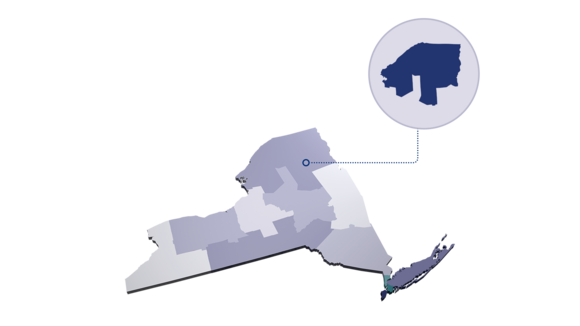
by Konstantin Sikhaou, Labor Market Analyst, North Country Region
Visitors have been coming to the North Country region for the past 250 years to see the area’s natural beauty and cultural heritage. Over time, the region’s travel and tourism sector, which includes a diverse set of related industries, has evolved to become a cornerstone of the seven-county North Country’s economy and remains a vital economic driver for the region.
Recent Tourism Trends
As outlined in the December 2024 issue of this newsletter, “New York’s travel and tourism sector has largely bounced back from the negative impacts of the COVID-19 pandemic.” That article also noted that “the sector continues to be a significant driver of economic growth and job creation across the state.”
The North Country’s travel and tourism sector is no exception. According to a series of regional reports released in 2024 by consulting firm Tourism Economics under contract to Empire State Development, direct visitor expenditures in the North Country in 2023 totaled $1.9 billion — up 7% from 2022’s level.
Essex County, home to Lake Placid, accounted for almost half (47%) of direct visitor spending in the region in 2023, with $910 million. Other counties in the North Country with at least a 10% share of regional visitor spending in 2023 include Jefferson (17%) and Clinton (10%). In terms of percentage growth in direct visitor spending between 2022 and 2023, Essex County experienced the most rapid increase (11%). Franklin and Hamilton counties tied for the No. 2 position in the region at 7%.
Projected Growth
The Leisure and Hospitality (L&H) industry group, which consists of two main components — Arts, Entertainment & Recreation and Accommodation & Food Services — accounts for the largest share of travel and tourism employment. L&H’s importance to the regional economy is underscored by its designation in a 2024 New York State Department of Labor report as one of seven “Significant Industries” in the North Country.
According to data from the Quarterly Census of Employment and Wages (QCEW), the L&H industry group employed over 15,500 workers in the North Country in 2023. Industry projections from the New York State Department of Labor expect L&H employment will continue to grow through the end of the decade. The job counts in Arts, Entertainment & Recreation and Accommodation & Food Services are both expected to nearly double — by +109.9% and +95.0%, respectively — between 2020 and 2030.
Attractions and Outdoor Recreation
Visitors are drawn to the North Country’s diverse attractions and events. Clinton County’s Ausable Chasm, often called the “Grand Canyon of the Adirondacks,” offers hiking, rafting and geological wonders. In Essex County, Lake Placid stands out as a world-renowned destination, celebrated for its Olympic legacy and year-round outdoor activities. The Adirondack Rail Trail, connecting Lake Placid, Saranac Lake and Tupper Lake, has become a major draw for outdoor enthusiasts.
Franklin County’s Saranac Lake Winter Carnival captivates visitors with its iconic ice palace and lively community celebrations, while Hamilton County invites nature and history enthusiasts to the Adirondack Experience — the Museum on Blue Mountain Lake. The Thousand Islands tourism region, which includes Jefferson and St. Lawrence counties, attracts visitors with scenic river cruises and Boldt Castle, a romantic architectural gem.
For winter sports lovers, Lewis County’s Tug Hill Plateau offers some of New York State’s finest snowmobiling and skiing. Meanwhile, St. Lawrence County’s cultural heritage is highlighted by the Frederic Remington Art Museum in Ogdensburg, which showcases works by the iconic Western artist. Seasonal festivals, music events and harvest celebrations further enhance the region’s appeal.
Tourism Infrastructure Boosted
Significant investments have strengthened the North Country’s tourism infrastructure. In January 2024, $13.1 million was allocated for the Adirondack Rail Trail, enhancing outdoor recreation opportunities. The state also committed $32 million to redevelop North Hudson (Essex County) into a tourism and recreation hub, revitalizing the community and showcasing its attractions.
The lodging sector has seen substantial growth, with new projects such as the Saranac Waterfront Lodge, the 191-room Cambria Hotel in Lake Placid (Essex County), and a 120-room hotel on Lake Champlain in Plattsburgh (Clinton County). Additionally, the NewVida Preserve in Jay (Essex County) continues to expand its offerings to meet growing visitor demand. These developments not only improve visitor experiences, but also create temporary construction and permanent jobs, boosting the regional economy.
Concluding Thoughts
The North Country’s travel and tourism sector is poised to grow even more vibrant in the coming years. With its stunning natural wonders, rich cultural traditions, and smart investments in tourism, the region is shaping a promising future. Visitors keep coming back for unforgettable experiences, and local communities are thriving thanks to the jobs and opportunities the travel and tourism sector affords.
By balancing economic development with environmental stewardship, the North Country solidifies its reputation as a premier destination while maintaining its unique character. It’s a place where natural beauty and culture create lasting appeal for generations to come.
|
|
 In December 2024, New York State’s seasonally adjusted private sector job count increased over the month by 7,200, or 0.1%, to 8,411,900. In addition, the state’s seasonally adjusted unemployment rate held steady at 4.4% in December 2024, while New York’s seasonally adjusted labor force participation rate held steady at 61.2%.
Capital
Over the past year, the private sector job count in the Capital Region rose by 1,400, or 0.3%, to 440,600 in December 2024. The largest gains occurred in the following sectors:
- education and health services (+3,200)
- manufacturing (+500)
Job losses were largest in the following sectors:
- trade, transportation and utilities (-1,200)
- information (-400)
- natural resources, mining and construction (-300)
- professional and business services (-300)
Central NY
The number of private sector jobs in the Syracuse metro area increased over the past year by 5,400, or 2.1%, to 263,400 in December 2024. The largest job gains occurred in the following sectors:
- education and health services (+2,900)
- professional and business services (+900)
- trade, transportation and utilities (+700)
- leisure and hospitality (+600)
- natural resources, mining and construction (+400)
The following sector lost jobs over the year:
Finger Lakes
From December 2023 to December 2024, the number of private sector jobs in the Rochester metro area rose by 8,100, or 1.8%, to 463,300. The largest job gains occurred in the following sectors:
- education and health services (+7,400)
- leisure and hospitality (+1,800)
- financial activities (+700)
Losses occurred in the following sectors:
- professional and business services (-1,000)
- trade, transportation and utilities (-700)
- information (-300)
Hudson Valley
Over the past year, the number of private sector jobs in the Hudson Valley grew by 9,700, or 1.2%, to 833,800 in December 2024. The largest job gains occurred in the following sectors:
- education and health services (+8,200)
- other services (+3,800)
- leisure and hospitality (+2,400)
- financial activities (+800)
Job losses occurred in the following sectors:
- natural resources, mining and construction (-1,900)
- professional and business services (-1,700)
- trade, transportation and utilities (-1,500)
- information (-500)
Long Island
For the year ending December 2024, private sector jobs on Long Island increased by 16,200, or 1.4%, to 1,173,400. Job gains occurred in the following sectors:
- education and health services (+10,600)
- leisure and hospitality (+6,700)
- natural resources, mining and construction (+3,600)
- other services (+1,100)
Job losses were greatest in the following sectors:
- professional and business services (-3,000)
- trade, transportation and utilities (-1,900)
- manufacturing (-400)
- financial activities (-300)
Mohawk Valley
For the 12-month period ending December 2024, the number of private sector jobs in the Mohawk Valley region increased by 800, or 0.6%, to 142,900. The following sectors had the largest over-the-year employment gains:
- education and health services (+900)
- leisure and hospitality (+200)
- natural resources, mining and construction (+200)
The largest job loss occurred in the following sector:
New York City
The private sector job count in New York City rose over the past year by 77,700, or 1.9%, to 4,246,800 in December 2024. Job gains occurred in the following sectors:
- education and health services (+84,000)
- leisure and hospitality (+18,800)
- trade, transportation and utilities (+2,900)
- other services (+1,100)
Job losses occurred in the following sectors:
- information (-11,000)
- natural resources, mining and construction (-9,700)
- professional and business services (-4,100)
- financial activities (-2,900)
- manufacturing (-1,400)
North Country
The number of private sector jobs in the North Country region rose over the past year by 200, or 0.2%, to 109,400 in December 2024. Job gains occurred in the following sectors:
- leisure and hospitality (+400)
- education and health services (+300)
Southern Tier
For the 12-month period ending December 2024, the number of private sector jobs in the Southern Tier region decreased by 1,400, or 0.6%, to 216,200. The largest gain occurred in the following sector:
- natural resources, mining and construction (+300)
The largest job losses occurred in the following sectors:
- trade, transportation and utilities (-900)
- professional and business services (-600)
- education and health services (-200)
Western NY
Over the past 12 months, the private sector job count in the Buffalo-Niagara Falls metro area rose by 4,000, or 0.9%, to 473,800 in December 2024. The largest gains occurred in the following sectors:
- education and health services (+3,000)
- leisure and hospitality (+1,200)
- natural resources, mining and construction (+900)
- trade, transportation and utilities (+300)
The largest job loss occurred in the following sector:
- professional and business services (-1,600)
|
|
|
Click the button below to become a subscriber to Employment in New York State

|
|
|
|
|