|

“New and young companies are the primary source of job creation in the American economy.”
Kauffman Foundation
by Steven Koczak, Ph. D., Program Research Specialist, and Kevin Jack, Deputy Director
Studies have shown that new businesses make an outsized contribution to fostering job creation and productivity growth in the U.S. economy. Moreover, the creation of new, small businesses represents a critical part of the American economic psyche. Many employees aspire to one day become employers themselves. Every big business had to start someplace — big or small — and every old business was once new.
Given the importance of new business formation, it is surprising to learn the topic hasn’t been studied more often. In this article, we examine some of the characteristics found in New York’s economic environment that make the state a leader in new business formation. We also look at recent trends in new business creation in the state. This is done by analyzing business applications data, a leading indicator of business formation, that are reported through the U.S. Census Bureau’s Business Formation Statistics (BFS) program.
Recent Research
A 2023 study by analysts at the Federal Reserve Bank-Atlanta (FRB-A), which was summarized in a 2024 Atlanta Fed newsletter article, was a recent attempt to remedy the situation. The authors took advantage of new data sources to analyze the formation of new businesses within the U.S. Using these data, they developed three principal metrics:
- Applications for Employer Identification Numbers (EINs) per capita
- Business start-ups per capita (i.e., EIN applications that transition to an employer business within eight quarters after application)
- Transition rate (rate of transition between EIN applications and formation of start-ups)
The FRB-A analysts examined all three metrics and found considerable variation existed across states. For example, some states generated less than 0.5 start-ups per capita, while others had nearly 2.6 start-ups per capita. There was also substantial variation in applications per capita and transition rates across the states.
New York: The Very Heart of It
The FRB-A analysts grouped their results into various ranges. In applications for EINs per capita and transition rate, New York State was in the second-highest range. In start-ups per capita, we were in the highest range. The FRB-A authors noted, “[i]n terms of prolific states for start-ups, eight western states, plus Florida and New York, had more than two for every 1,000 prime-age adults between 2010 and 2016.”
Based on the FRB-A study, New York State appears to possess characteristics that help promote business formation. One such characteristic is the state’s large and wealthy population. With a population of more than 19.5 million in 2023, New York ranks fourth in the nation. A large population potentially means a robust market for goods and services, and, accordingly, a potentially robust cauldron for new business creation.
In addition, New York is a wealthy state. The state’s real GDP — measured in chained 2017 dollars — topped $1.77 trillion in 2023, ranking the Empire State #3 in the nation. New York State also ranked #3 in terms of total private sector wages ($745.1 billion) in 2023.
A primary driver of wealth in the state is the financial juggernaut that is Wall Street, whose workers earned an average salary of more than $360,000 and total wages of nearly $1.3 billion in 2023. As the financial capital of the world, businesses in New York have access to much needed capital for growth and expansion.
Another important institution in the state that helps to support business formation is “business incubators,” which are physical locations set up to house different sorts of new businesses. The Business Incubator Association of New York State indicates it has more than 110 member incubators, which collectively host 2,000 start-up businesses in the state.
Business Formation in NYS: Regional & County Analysis
In this section, we analyze annual BFS data for New York State’s 62 counties and 10 labor market regions. Our analysis follows work initially conducted by Dr. Mark White at the University of Illinois Urbana-Champaign. Our focus is on three key metrics:
-
Level of New Business Applications: Overall number of applications in 2023
-
Growth in New Business Applications: Percent change between 2019 and 2023, expressed as a Compound Annual Growth Rate (CAGR)
-
Concentration of New Business Applications: Business applications per capita in 2023 (number of start-up applications per 10,000 area residents)
In 2023, New York had more than 312,400 applications for new businesses, ranking us #4 in the nation. New business applications in the state grew 8.1% annually in 2019-23. On a per capita basis, there were 160 applications per 10,000 state residents in 2023, which ranked NYS 16th in the U.S.
Regional Analysis
Our analysis highlights the economic importance of New York City, which accounted for just under 170,000 business applications, or about 54% of the state total. The second highest number of applications was in Long Island (47,300), and the third highest was in the Hudson Valley (36,300). Together, the state’s three Downstate labor market regions were responsible for about 80% of total business applications in the state in 2023.
Ranked by percentage increases in new business applications, New York’s seven Upstate labor market regions experienced the fastest annual growth in 2019-23:
- Capital (+16.1%)
- Western New York (+11.6%)
- Southern Tier (+11.5%)
- Finger Lakes (+11.4%)
- Central New York (+10.7%)
- North Country (+10.5%)
- Mohawk Valley (+10.4%)
In contrast, annual growth in the three Downstate labor market regions — Hudson Valley (+8.5%), Long Island (+7.1%) and New York City (+6.9%) — lagged over this period.
In 2023, there was wide variation in new business applications per capita across regions. The highest concentrations — measured as number of applications per 10,000 residents — were found in the most populous regions. In descending order, the regional concentrations were:
- New York City (205)
- Long Island (163)
- Hudson Valley (151)
- Capital (151)
- Finger Lakes (97)
- Western New York (95)
- Central New York (83)
- Southern Tier (78)
- Mohawk Valley (76)
- North Country (70)
County Analysis
It will come as no surprise to learn that the total number of business applications in a county is closely connected to its population. In New York State, the number of business applications in 2023 ranged from a high of more than 55,000 in Kings County (Brooklyn), with more than 2.5 million people, to 23 in Hamilton County, with just over 5,000 people.
Of the 10 counties in the state with the most rapid annual growth in business applications in 2019-23, all were located Upstate, including seven non-metro counties. The top 10 counties and their annual growth rates include:
- Albany (Capital), 23.3%
- Chemung (Southern Tier), 19.5%
- Lewis (North Country), 16.3%
- Wyoming (Finger Lakes), 15.6%
- Cayuga (Central New York), 14.6%
- Jefferson (North Country), 13.9%
- Sullivan (Hudson Valley), 13.8%
- Delaware (Southern Tier), 13.6%
- Chautauqua (Western New York), 13.6%
- St. Lawrence (North Country), 13.4%
In contrast to the counties with the fastest growth rates, the 10 counties in New York with the highest number of new business applications per 10,000 residents in 2023 were mostly Downstate. This list includes:
- New York (326)
- Albany (280)
- Kings (215)
- Rockland (202)
- Nassau (185)
- Queens (168)
- Westchester (156)
- Sullivan (145)
- Suffolk (143)
- Orange (142)
Summing Up
We’ve analyzed recent trends in new business applications in New York. Not surprisingly, New York City and the other Downstate labor market regions generate about 80% of the state’s total business applications. In addition, Downstate has the highest concentrations of new business activity, when measured on a per capita basis.
However, the 10 counties in New York State that experienced the most rapid growth in new business applications in 2019-23 were all located Upstate. Most of these fastest-growing Upstate counties are outside of metropolitan areas.
In this article, we’ve reviewed a few of the many characteristics that are associated with the formation of new businesses. New York State possesses many of them. Unsurprisingly, studies such as the one from the Federal Reserve Bank-Atlanta, tend to support this claim. However, it should be clear that it’s the confluence of all these characteristics that make New York a good place to start a new business.
|
|
“Local job postings tell us what specific skills, certifications and qualifications are currently most in demand by regional employers.”
by Karen Knapik-Scalzo, Labor Market Analyst, Central New York
The Central New York economy has been adding jobs at a strong pace in 2024. For example, from June 2023 to June 2024, the region’s 2.5% rate of growth in nonfarm jobs exceeded the comparable figure (+1.6%) for the nation.
What specifically is the source of this labor demand and job growth? To answer that question, we analyzed recent local area job postings from data analytics firm Lightcast. Job postings are widely considered an important source of real-time labor market information as they provide analysts with insights on the types of jobs local employers are attempting to fill the most. In addition, these local job postings tell us what specific skills, certifications and qualifications are currently most in demand by regional employers.
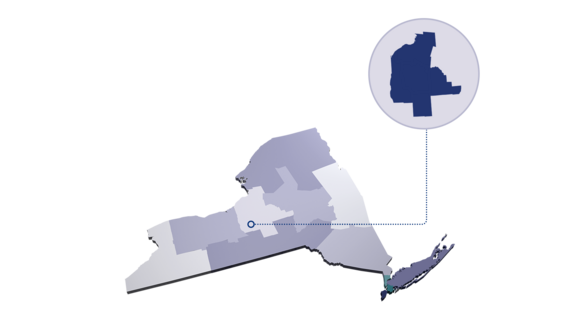
A Look at Recent CNY Job Postings
Lightcast gathers job postings data from a large variety of online sources, including simplyhired.com, indeed.com, dejobs.org, craigslist.org, careerjet.com and many others. In January-June 2024, there were 48,716 unique job postings — posted by 5,655 employers — in the five-county Central New York region.
Not surprisingly, Onondaga County — which represents about 70% of the region’s Gross Domestic Product, per figures from the U.S. Bureau of Economic Analysis — accounted for 35,438, or 73%, of job postings in Central New York during this six-month period. This was followed by Oswego County (4,154), Madison County (3,513), Cayuga County (3,236) and Cortland County (2,375). The cities where the most job postings were located included Syracuse, East Syracuse, Liverpool, Auburn, Cortland and Oswego.
Of the 35,000+ job postings that listed a wage, the median yearly advertised salary (meaning half of the wages are higher and half are lower) was $47,700. The median posting duration during this period was 25 days.
Looking at the experience and education requirements listed in the job postings provides deeper insights into the region’s labor market. Most job postings (58%) had no minimum experience level listed, while 17% listed two to three years of experience and 15% listed up to one year of experience.
More than 32,600 job postings in Central New York listed a formal educational requirement. The distribution by degree level was: high school or GED (37%), associate degree (17%), bachelor’s degree (31%) and master’s, Ph.D. or professional degree (15%).
Top Industries and Occupations
The region’s employers posting the most job openings in January-June 2024 tended to be large employers centered in the education, healthcare, government and retail trade sectors. Specifically, the top five employers listing the most jobs were Syracuse University, SUNY Upstate Medical University, New York State, Trinity Health and Aerotek.
The most common occupations local employers listed jobs for included: registered nurses; retail salespersons; supervisors of retail sales workers; heavy and tractor-trailer truck drivers; customer service representatives; laborers and freight, stock and material movers; secretaries and administrative assistants; maintenance and repair workers; janitors and cleaners; and food service managers.
Skills in Demand
Some of the top specialized skills Central New York employers were seeking were nursing, merchandising, auditing, marketing and project management. The most common “soft skills” local employers sought were communication, as employees need to communicate effectively with customers, supervisors and co-workers. Other in-demand soft skills included customer service, management, sales and operations.
Today, computer skills are important in virtually every type of work setting. Top computer software skills most in demand by local employers include Microsoft Office suite; spreadsheets; Epic EMR; SAP Applications; and Salesforce.
Many positions require specific licensing, certifications or security clearances. These requirements are often found in diverse settings such as health care, trucking and companies working on military contracts. Employers also often require employees to have reliable transportation to get to work.
The formal credentials most in demand, according to our analysis of local job postings, include: valid driver’s license; Registered Nurse (RN) license; Basic Life Support (BLS) certification; Cardiopulmonary Resuscitation (CPR) certification; Licensed Practical Nurse (LPN) license; Nurse Practitioner (APRN-CNP) license; Advanced Cardiovascular Life Support (ACLS) certification; Commercial Driver’s License (CDL); Certified Nursing Assistant (CNA) certification; and possessing a security clearance.
Looking Ahead
Job postings data are an extremely valuable source of labor market information to a variety of local stakeholders. For example, students and jobseekers use this information as they seek employment opportunities. In addition, training providers, educators, planners and workforce development professionals use this information for long-range planning purposes. These groups also use postings data to make decisions regarding educational and training offerings in the region. Moving forward, job postings will continue to be an important source of real-time data on labor market conditions in Central New York.
|
|
 In June 2024, New York State’s seasonally adjusted private sector job count increased over the month by 6,900, or 0.1%, to 8,379,000. In addition, the state’s seasonally adjusted unemployment rate held steady at 4.2% in June 2024, while New York’s seasonally adjusted labor force participation rate also held steady at 61.3%.
Capital
Over the past year, the private sector job count in the Capital Region rose by 5,400, or 1.2%, to 446,500 in June 2024. Job gains occurred in the following sectors:
- education and health services (+5,200)
- leisure and hospitality (+3,300)
Job losses occurred in the following sectors:
- professional and business services (-1,400)
- trade, transportation and utilities (-1,100)
- information (-600)
Central NY
The number of private sector jobs in the Syracuse metro area increased over the past year by 7,200, or 2.8%, to 262,000 in June 2024. Job gains occurred in the following sectors:
- professional and business services (+2,500)
- education and health services (+2,300)
- leisure and hospitality (+1,900)
- trade, transportation and utilities (+400)
- financial activities (+200)
- natural resources, mining and construction (+200)
- other services (+200)
Job losses occurred in the following sectors:
- manufacturing (-300)
- information (-200)
Finger Lakes
From June 2023 to June 2024, the number of private sector jobs in the Rochester metro area rose by 6,100, or 1.4%, to 457,700. Job gains were greatest in the following sectors:
- education and health services (+4,200)
- leisure and hospitality (+2,300)
- financial activities (+500)
- trade, transportation and utilities (+400)
Job losses occurred in the following sectors:
- professional and business services (-1,200)
- information (-400)
Hudson Valley
Over the past year, the number of private sector jobs in the Hudson Valley grew by 7,600, or 0.9%, to 833,300 in June 2024. Job gains occurred in the following sectors:
- education and health services (+9,500)
- leisure and hospitality (+3,300)
- financial activities (+700)
- other services (+400)
Job losses occurred in the following sectors:
- trade, transportation and utilities (-2,500)
- professional and business services (-1,300)
- natural resources, mining and construction (-1,100)
- information (-900)
- manufacturing (-500)
Long Island
For the year ending June 2024, private sector jobs on Long Island increased by 10,100, or 0.9%, to 1,183,900. Job gains were largest in the following sectors:
- education and health services (+11,100)
- leisure and hospitality (+3,500)
- natural resources, mining and construction (+1,800)
- other services (+1,200)
- manufacturing (+600)
Job losses occurred in the following sectors:
- trade, transportation and utilities (-4,800)
- professional and business services (-2,800)
- information (-700)
Mohawk Valley
For the 12-month period ending June 2024, the number of private sector jobs in the Mohawk Valley region increased by 1,800, or 1.3%, to 144,800. The following sectors had the largest over-the-year employment gains:
- education and health services (+1,300)
- financial activities (+300)
- natural resources, mining and construction (+300)
- leisure and hospitality (+200)
The largest job loss occurred in the following sector:
New York City
The private sector job count in New York City rose over the past year by 53,900, or 1.3%, to 4,195,400 in June 2024. Job gains occurred in the following sectors:
- education and health services (+84,300)
- leisure and hospitality (+11,900)
- other services (+400)
Job losses occurred in the following sectors:
- information (-14,400)
- trade, transportation and utilities (-9,600)
- professional and business services (-7,600)
- natural resources, mining and construction (-7,100)
- financial activities (-2,700)
- manufacturing (-1,300)
North Country
The number of private sector jobs in the North Country region rose over the year by 700, or 0.6%, to 111,800 in June 2024. Gains were greatest in the following sectors:
- education and health services (+700)
- professional and business services (+300)
- natural resources, mining and construction (+200)
The greatest job losses occurred in the following sectors:
- information (-200)
- trade, transportation and utilities (-200)
Southern Tier
For the 12-month period ending June 2024, the number of private sector jobs in the Southern Tier region increased by 2,900, or 1.4%, to 217,000. The greatest employment gains occurred in the following sectors:
- education and health services (+2,300)
- leisure and hospitality (+1,400)
- natural resources, mining and construction (+500)
Job losses occurred in the following sectors:
- manufacturing (-500)
- professional and business services (-500)
- trade, transportation and utilities (-400)
Western NY
Over the past 12 months, the private sector job count in the Buffalo-Niagara Falls metro area rose by 6,300, or 1.3%, to 476,200 in June 2024. The greatest job gains occurred in the following sectors:
- education and health services (+3,900)
- leisure and hospitality (+1,400)
- natural resources, mining and construction (+800)
- financial activities (+500)
- manufacturing (+400)
- trade, transportation and utilities (+400)
Job losses occurred in the following sectors:
- professional and business services (-900)
- information (-300)
|
|
|
Click the button below to become a subscriber to Employment in New York State

|
|
|
|
|