|
 by Kevin Phelps, Research Specialist, and Steven Koczak, PhD, Research Specialist
Each year, we celebrate “Veterans Day” — originally known as “Armistice Day” — to commemorate the end of World War I, which occurred on November 11, 1918. In honor of Veterans Day, this article shares some facts about the more than half a million veterans currently living in New York as well as some highlights from a new report from the U.S. Department of Defense (DoD) that contains state-level information on defense contracts and military personnel. Unless otherwise noted, data discussed here pertain to federal Fiscal Year 2022 (FY2022), which covers the October 2021-September 2022 period.
NYS Veterans
New York State’s military tradition extends back more than 250 years. Our state played a critical role in the American Revolution, hosting, among other engagements, the turning point of the war (Battle of Saratoga, 1777), a series of important skirmishes leading up to that battle, and several battles over the strategically important New York City. Later, New York provided about 450,000 troops — more than any other state — to the Union forces during the American Civil War.
In 2022, New York State was home to more than 580,000 veterans, per estimates from the American Community Survey. This group accounts for 3.7% of the state’s civilian population aged 18 years and over and represents the ninth-largest veteran population in the nation.
More than half of New York’s veterans are over the age of 65, including 33.3% who are 75+ years old. With just over 200,000 members, Vietnam era veterans comprise the single largest group by period of service, while veterans who served in or around the Persian Gulf or Afghanistan theaters (September 2001 or later) are the second largest group with 117,500 members. The veteran groups with the smallest number of members are also the oldest: World War II (7,200) and the Korean War (37,000).
DoD Spending in NYS
During FY2022, New York came in #5 in overall defense spending, at $28.1 billion, behind only Virginia, Texas, California and Florida. The top five states, including New York, together accounted for 42.1% of all defense spending tracked by the DoD report, and New York by itself accounted for 5.0%. New York also ranked #4 in the nation in terms of “defense contract” spending ($24.5 billion) and #3 in terms of “defense grant” spending ($711.5 million).
New York State’s economy is very diverse, and our state’s Gross Domestic Product (GDP) is exceptionally large. As of 2022, New York State’s real (inflation-adjusted) GDP was the third largest in the nation, trailing behind only California and Texas. Consequently, despite having the fifth highest level of overall defense spending in absolute dollars, the Empire State was ranked 32nd in terms of defense spending as a percentage share of state GDP (1.4%) in FY2022.
In the early 1990s, the New York State Governor’s Defense Advisory Council issued a report on U.S. defense spending within the state. Combining that report’s data with DoD’s data for FY2022 suggests that real defense spending in New York was on the decline in the late 1980s and early 1990s – due in large part to the fall of the Berlin Wall in 1989, the collapse of the former Soviet Union in 1991 and the subsequent end of the Cold War – but had rebounded in a big way by 2022 (Note: Figures are in 2022 dollars):
- 1987: $22.3 billion
- 1990: $14.5 billion
- 2022: $24.5 billion
The top five counties for defense contract spending in New York State in FY2022 were New York (Manhattan), Monroe, Tioga, Onondaga and Suffolk. By contrast, according to New York’s analysis in the 1990s, most defense contract spending went to firms in Nassau and Suffolk counties.
The top ten recipients of defense contracts in New York State in FY2022, according to the DoD report, were:
- Pfizer ($16.7 billion)
- Lockheed Martin ($2.3 billion)
- L3Harris Technologies ($1.7 billion)
- BAE Systems ($177.0 million)
- SRC ($150.0 million)
- Booz Allen Hamilton ($141.2 million)
- St. Vincent’s Catholic Medical Centers of NY ($117.9 million)
- Saab ($111.4 million)
- WPP ($108.9 million)
- Jamaica Bearings ($106.6 million)
The size of Pfizer’s DoD contract is notable. At $16.7 billion, it was more than three times as large as the combined value of the defense contracts received by the nine next largest contractors ($4.9 billion) in the state. According to the press release that accompanied the DoD’s report, Pfizer’s contract, the fourth largest defense contract nationwide in FY2022, was for COVID-19 vaccines. Pfizer’s contract was nearly 10 times as large as the $1.8 billion contract with Massachusetts-based Moderna for its version of the vaccine.
Military Installations in NYS
According to the DoD report, New York State is home to 17 military installations, spread out across Kings, Westchester, Jefferson, Suffolk, Onondaga, Niagara, Saratoga, Oneida, Schenectady, Orange and Albany counties. In FY2022, there were about 58,000 total DoD personnel in New York State (rank #15), with a total payroll of $2.9 billion (rank #17). Of those, approximately 32% of DoD personnel in the state were active-duty military, 28% in the National Guard, 20% in the Reserves and 20% civilian.
Broken out by service branch, approximately 71% of active-duty military were allocated to the Army, 16% to the Air Force, 8% to the Navy/Marines and 5% to “other defense.”
In FY2022, two New York counties – Jefferson and Orange – accounted for the lion’s share of DoD personnel in the state. Jefferson County, home to Fort Drum and the Army’s famed 10th Mountain Division, had by far the most DoD personnel (17,165) of any county in the state. The county’s strategic location on our nation’s northern border during the War of 1812 played a key role in the establishment of Fort Drum’s predecessors.
Orange County, its next largest competitor and the home of the U.S. Military Academy at West Point, had 6,655 personnel. Ever since American Gen. Benedict Arnold negotiated to hand over West Point to the British in 1780 during the Revolutionary War, the site’s strategic location has not been in doubt. Today, West Point, the oldest continuously occupied regular army post in the U.S., has a student body of about 4,400.
Rounding out the list of the top five counties in New York State with the most DoD personnel in FY2022 are Onondaga County (2,878), Oneida County (2,808) and Niagara County (2,745).
Military Spending’s Economic Impact
It’s no secret that militaries, especially very large and high-tech ones such as that of the U.S., are expensive. It’s also no secret that they have an economic impact that stretches well beyond direct spending. This impact is so well established in the economic literature that sometimes military spending is called “counter-cyclical.” This means that it resists and can sometimes reverse negative business cycle fluctuations. Debates in the literature exist over whether or not cutting military spending can truly result in a “peace dividend,” wherein the money cut from the military budget can be re-routed into spending that benefits the economy roughly as much as did the military spending.
The impact of defense spending on employment, especially relative to other government spending options, has been debated for a long time. In the early 1990s, New York reported that DoD cited a figure of 25,000 jobs supported per $1 billion in defense spending. Other estimates tend to be more modest; reports from Brown University and the Center for American Progress estimate 11,200 and 10,000 jobs per $1 billion in defense spending, respectively.
Growth in military employment also has ripple effects that spread throughout the state’s labor market. Data from Lightcast, an analytics firm, show that the state’s military sector has an employment multiplier of 2.20. In other words, for every 100 direct jobs added by the state’s military sector, an additional 120 spin-off jobs are created in a variety of industries across the state. Regardless of the disagreements on the size of its overall employment impact, research has shown that defense spending has a positive effect on economic growth.
Conclusion
Since the Revolutionary War, New York State, its service members and its world-class military installations have played a pivotal role in our national defense. Today, our state remains a military powerhouse as evidenced by the recent DoD report. For more information on the report, visit: oldcc.gov/dsbs-fy2022.
|
|
“The travel and tourism sector plays a significant role in the economic health of Western New York.”
|
|
|
by Timothy Glass, Labor Market Analyst, Western New York Region
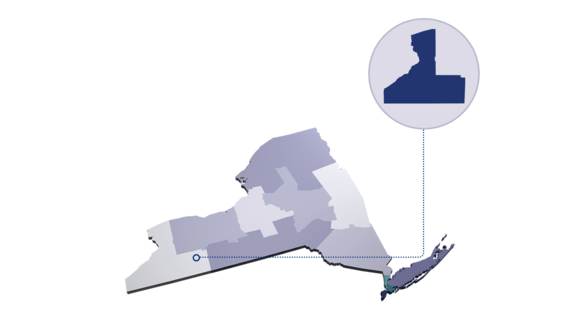
The travel and tourism sector is a major economic driver in the Empire State. In 2022, the state received a record 291.5 million visitors. In turn, these visitors generated more than $78.6 billion in direct spending and $123 billion in total economic impact for the state. Over this period, the five-county Western New York (WNY) region received more than $3.8 billion in direct visitor expenditures.
Leisure and Hospitality Jobs Key
The leisure and hospitality industry typically employs the most travel and tourism sector workers in a given area. In WNY, leisure and hospitality accounted for 12.6% of private sector jobs in 2022, per the Quarterly Census of Employment and Wages (QCEW). During the same period, leisure and hospitality workers held 12.2% of the private sector jobs in the Buffalo-Niagara Falls metro area (Erie and Niagara counties).
QCEW data indicate that the three “minor” counties in WNY — meaning they are outside of a metro area — all had a greater reliance on leisure and hospitality jobs in 2022. In descending order, leisure and hospitality’s share of private sector jobs by county includes: Cattaraugus, 16.5%; Allegany, 15.7%; and Chautauqua, 14.2%.
Attractions by County
Erie County, by far the region’s largest county in terms of population and employment, is home to many cultural destinations. Among the more prominent attractions are the newly renovated AKG Art Museum, Buffalo Museum of Science, Explore and More Children’s Museum, the Buffalo Zoo, Shea’s Performing Art Center, Buffalo Naval Park and Kleinhans Music Hall.
If sports are more to your liking, Erie County is home to several national sports teams. The Buffalo Bills football team plays at Highmark Stadium in Orchard Park, while the Buffalo Bandits lacrosse team and the Buffalo Sabres hockey team both play at KeyBank Center in downtown Buffalo.
Erie County also is home to many festivals and events held throughout the year. None is bigger than the Erie County Fair, which is one of the largest and oldest fairs in the nation. Some other festivals of note include the Eden Corn Festival, Allentown Art Festival, Dyngus Day Buffalo Festival and the National Buffalo Chicken Wing Festival, among others.
Directly north of Erie County is Niagara County, which is home to one of the world’s natural wonders — Niagara Falls. The falls have been a leading international tourist attraction for 200 years. The city of Niagara Falls is also home to the Niagara Falls Aquarium, the Fashion Outlets of Niagara Falls, Niagara Falls Wax Museum of History and the Seneca Niagara Casino. Attractions outside of the city include Old Fort Niagara in Youngstown, and Lockport Locks and Erie Canal Cruises, based in Lockport.
Niagara County’s extensive number of wineries attracts many visitors to its wine trail. The county is also home to many interesting festivals such as the Peach Festival in Lewiston, the Niagara Celtic Heritage Festival, the Niagara Falls Blues Festival in downtown Niagara Falls and the Tap and Craft Festival.
Located in the southwestern corner of the state, the focal point of tourism in Chautauqua County is Chautauqua Lake and the Chautauqua Institution — a community on the lake that offers a unique mix of fine and performing arts, lectures, concerts, interfaith worship and programs, and recreational activities. The institution plays hosts to over 100,000 visitors each summer.
Other important draws in Chautauqua County include the Lucille Ball Desi Arnaz Museum and the National Comedy Center in Jamestown, which attract people from all over the U.S. The county is also home to 23 wineries and over 30,000 acres of vineyards. In addition, the online travel planning service Inspirock rates Panama Rocks Park, located in Chautauqua County, as the state’s #1 ranked park for nature and hiking trails. The county hosts two big festivals: the Great Blue Heron Festival in Sherman and the Festival of Grapes in Silver Creek.
Both Cattaraugus and Allegany counties offer a variety of tourism pursuits. Some of the destinations in Cattaraugus County include the Holiday Valley Ski Resort in Ellicottville, Seneca Allegany Casino in Salamanca and the Griffis Sculpture Park in East Otto.
Some of the featured attractions in Allegany County include the Tall Pines ATV Park in Andover and the Swain Ski resort in Swain. The town of Cuba is home to the Cuba Cheese Museum, which is not only the largest cheese museum in North America but is one of only three cheese museums in the world.
Summing Up
The travel and tourism sector plays a significant role in the economic health of Western New York and its five component counties. By selling its services and products to customers from outside of Western New York, the region’s travel and tourism sector generates income and jobs that help to support the overall Western New York economy.
|
|
 In September 2023, New York State’s seasonally adjusted private sector job count increased over the month by 7,500, or 0.1%, to 8,261,800. In addition, the state’s seasonally adjusted unemployment rate rose from 3.9% to 4.0% in September, while New York’s seasonally adjusted labor force participation rate rose from 61.5% to 61.6%.
Capital
Over the past year, the private sector job count in the Capital Region rose by 9,100, or 2.1%, to 442,800 in September 2023. Job gains were largest in education and health services (+5,500), leisure and hospitality (+3,400), professional and business services (+1,600), financial activities (+600) and other services (+400). Losses occurred in trade, transportation and utilities (-1,900) and manufacturing (-600).
Central NY
The number of private sector jobs in the Syracuse metro area increased over the past year by 5,100, or 2.0%, to 261,400 in September 2023. Gains occurred in professional and business services (+2,200), leisure and hospitality (+2,100), education and health services (+800), other services (+300), natural resources, mining and construction (+200) and trade, transportation and utilities (+200). Job losses were largest in manufacturing (-400).
Finger Lakes
From September 2022 to September 2023, the private sector job count in the Rochester metro area rose by 1,900, or 0.4%, to 449,800. Job gains occurred in education and health services (+5,400), other services (+600), manufacturing (+400) and trade, transportation and utilities (+400). Employment losses were greatest in professional and business services (-2,900) and leisure and hospitality (-1,400).
Hudson Valley
Over the past year, the number of private sector jobs in the Hudson Valley grew by 9,600, or 1.2%, to 805,200 in September 2023. Job gains occurred in education and health services (+11,700), leisure and hospitality (+6,200) and other services (+2,100). Regional employment losses were greatest in professional and business services (-5,300), trade, transportation and utilities (-2,300), natural resources, mining and construction (-1,300), manufacturing (-600) and information (-500).
Long Island
For the year ending September 2023, private sector jobs on Long Island increased by 9,300, or 0.8%, to 1,148,600. Job gains were greatest in education and health services (+8,200), leisure and hospitality (+5,700), professional and business services (+3,800) and manufacturing (+1,800). Employment losses were largest in trade, transportation and utilities (-4,800), natural resources, mining and construction (-4,100) and financial activities (-1,000).
Mohawk Valley
For the 12-month period ending September 2023, the number of private sector jobs in the Mohawk Valley region increased by 700, or 0.5%, to 141,100. Over-the-year employment gains were greatest in education and health services (+700) and leisure and hospitality (+500). Job losses occurred in manufacturing (-400) and trade, transportation and utilities (-300).
New York City
The private sector job count in New York City rose over the past year by 109,500, or 2.7%, to 4,110,700 in September 2023. Gains were largest in education and health services (+96,300), leisure and hospitality (+25,800), natural resources, mining and construction (+15,200), financial activities (+3,200) and professional and business services (+1,900). Job losses were greatest in information (-22,900) and trade, transportation and utilities (-10,900).
North Country
For the 12-month period ending September 2023, the private sector job count in the North Country region increased by 700, or 0.6%, to 109,700. Over-the-year job gains were greatest in leisure and hospitality (+600), manufacturing (+200) and natural resources, mining and construction (+200). Losses were focused in trade, transportation and utilities (-300).
Southern Tier
For the year ending September 2023, the number of private sector jobs in the Southern Tier rose by 700, or 0.3%, to 217,500. Employment gains were greatest in leisure and hospitality (+800), education and health services (+600) and other services (+200). Regional employment losses were largest in natural resources, mining and construction (-400), manufacturing (-300) and professional and business services (-200).
Western NY
Over the past 12 months, the private sector job count in the Buffalo-Niagara Falls metro area rose by 6,800, or 1.5%, to 466,700 in September 2023. Employment gains occurred in leisure and hospitality (+5,000), professional and business services (+2,300), other services (+1,500), education and health services (+1,400) and manufacturing (+1,200). Employment losses were greatest in trade, transportation and utilities (-3,400) and financial activities (-1,000).
|
|
|
|
|