The 2022 monitoring season is in full swing for both lakes and streams across the state! Getting the opportunity to reconnect with your lake or stream, and make regular monitoring trips, is such a satisfying way to ring in spring. It has been a chilly start to the season, but hopefully a sweatshirt and travel mug of coffee can help you through until seasonably warm weather finally settles in.
Since this is the spring issue of our newsletter, we generally like to include some friendly reminders to ensure the data you collect is accurate and useful. We know that for many of you, monitoring your lake or stream has become so second nature you hardly even need to think about it. However, we have a lot of new volunteers joining the ranks this year, so hopefully everyone will find these reminders helpful. But, before launching into all of that, the very concept of a new cadre of volunteers joining veteran volunteers out on our waters this year makes us want to remind everyone that we have an MPCA Volunteer Water Monitoring Facebook Group. This group is a great platform for volunteers to share their monitoring experiences, ask questions and connect with our volunteer community. It has the potential to be a place for mentorship between long-term volunteers and volunteers new to the program. So, please join, share and connect!
|
Now, on to those monitoring reminders....
1. Please return to the same location each time you monitor. Location consistency is very important (check out another story below for more details!). If you need clarification on your assigned location, or if you need to change locations, please email us at watervolunteers.mpca@state.mn.us.
2. When rating Physical Condition (for lakes), Appearance (for streams) and Recreational Suitability (for lakes and streams) please choose only one number (“2-3” or “3+” will not be used).
3. When taking Secchi measurements, remove sunglasses and turn your back to the sun if you are using a Secchi tube or take the measurement on the shaded side of the boat if you are using a Secchi disk.
4. For streams - please estimate the water level at your site each time you sample. The categories to choose from are broad, so don’t agonize too much over which one to choose. For assistance with determining which “Stream Stage Estimate” category to record refer to the laminated cheat sheet included in your monitoring kit. If you need a new cheat sheet let us know, we'd be happy to send one to you.
5. For lakes - please record the water color each time you monitor. Lake color can be quite variable, but to make categorizing responses easier, please only choose from the following colors: clear, green, stained and sediment. You can always provide more detail in the comments section regarding water color if you need to.
6. Also for lakes - surface water temperature readings are new this year. Taking these readings is optional and thermometers are currently not being provided by the MPCA. If you do choose to monitor surface water temperature, any aquatic thermometer available at an outdoor store (most of them are around $10) will work just fine.
Back to top
|
You can now view your 2021 Volunteer Water Monitoring Program data! To access your 2021 data, go to the Volunteer Monitoring Program Individual Site Report website. From there you can navigate to your data in one of two ways:
- Use the map tab to navigate to the monitoring site on your lake or stream. Click on the black triangle next to the lake ID or the black circle next to the stream ID. In the box that appears, click on "Volunteer Monitoring Report" . Your report will open in a new tab.
- Use the text tab to enter your monitoring site number (i.e. 01-0001-00-101 for lakes or S001-101 for streams) in the very bottom box titled "Citizen Monitoring Site or Lake ID number." The name of your lake or stream and the monitoring site number you entered should appear below. Click on the monitoring site number and your report will open.
If you have any questions regarding your report, please feel free to contact us at watervolunteers.mpca@state.mn.us.
Back to top
We are pleased to let you know that the 2021 issue of the Volunteer Water Monitoring Program’s annual yearbook, Reflections, is now available. We are presenting Reflections in a new format this year, through an engaging online platform: view the updated Reflections 2021 yearbook here.
For this past monitoring season's yearbook, we focus on volunteer stories and photos. In their own words, volunteers reflect on their time spent monitoring our lakes and streams, and share some of their experiences while out on the water. As so many have noted, the care volunteer monitors take to follow standardized procedures and share results supports water protection efforts, but it also provides opportunities to really notice nature, and to build a common appreciation for our shared waters.
We hope that you enjoy this issue of Reflections. Thank you for your continued commitment to water quality, to your lake or stream, and to the MPCA Volunteer Water Monitoring Program!
Back to top
|
Every 5 years the Environmental Protection Agency launches its nation-wide survey to assess the quality of our country’s lakes. The initiative started in 2007, and now in it’s fourth cycle, the National Lakes Assessment is set to take place again this summer 2022.
This initiative is funded by the EPA, but actually conducted by state agency staff across the country, and aims to answer questions such as:
- What is the current biological, chemical, physical, and recreational condition of lakes?
- For lakes with poor water quality – how bad is it and how widespread is it?
- Is the proportion of lakes with poor water quality getting better, worse, or staying the same over time?
- Which environmental stressors are causing poor lake water quality?
For the MPCA, participating in the National Lakes Assessment is just one piece of our larger monitoring work. Over 10 years ago the MPCA instituted an Intensive Watershed Monitoring schedule, where we monitor as many lakes and streams as we can in each watershed, every 10 years. During National Lake Assessment years, we conduct that monitoring – usually 50 lakes assigned by the EPA - and we choose to monitor an additional 100 lakes to ensure we can look for significant water quality differences within our own state.
|
All lakes monitored through the National Lakes Assessment are analyzed for nutrients, zooplankton, and phytoplankton. 50 Lakes will be sampled for algal toxins, emerging contaminants, herbicides, and pesticides. Check out our 2017 monitoring results on our NLA Data Page.
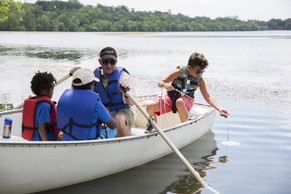
This summer, MPCA staff will launch large motor boats, small john boats and even canoes to reach all 150 lakes on our monitoring list. Participating in this nation-wide survey expands our understanding of our state’s water, elevates it to the federal level and allows us to compare our results with other states across the country. All in the hopes of contributing to a more holistic view of water quality conditions in the country.
Back to top
|
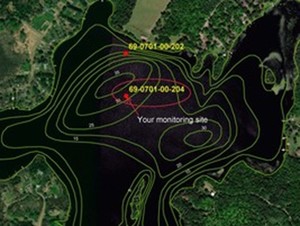
Your monitoring location. Your special spot. The place you return to time and again to take your clarity reading and log your data. You've been there so many times you could probably find it your sleep! What you may not realize is that your monitoring location is not only special to you, but to the MPCA as well.
All volunteers are assigned a monitoring location when they become Volunteer Water Monitors. All data collected by a volunteer are associated with that particular monitoring location. This is important because water clarity can vary across a lake or a stream reach.
Now, there may be times when you are tempted to scuttle over to an easier access point, or perhaps you don't have time to drive all the way to your exact monitoring location, so you take a reading at a different spot and write it on your datasheet. No harm, no foul, right? Au contraire! Understanding how Secchi readings may vary over time at a site is important for watershed planners and future Secchi disk readers alike.
If you can't make it to your monitoring location on a particular day, that's okay - just don't take a reading that day. Consistently collecting data in the same location is what is important. If you find your assigned monitoring location has become difficult or time consuming for you to travel to, we'd be happy to help identify another, more convenient monitoring location. The most important thing is that we know where you are collecting the data and that we are linking that data to the appropriate location on the lake. Happy monitoring!
Back to top
|
By Kenny Blumenfeld, Sr. Climatologist
Parts of Minnesota hardest-hit by the major drought of 2021 have since become extremely wet during the 2022 spring, leading to high stream and lake levels in northern parts of the state, where some areas have experienced historic flooding.
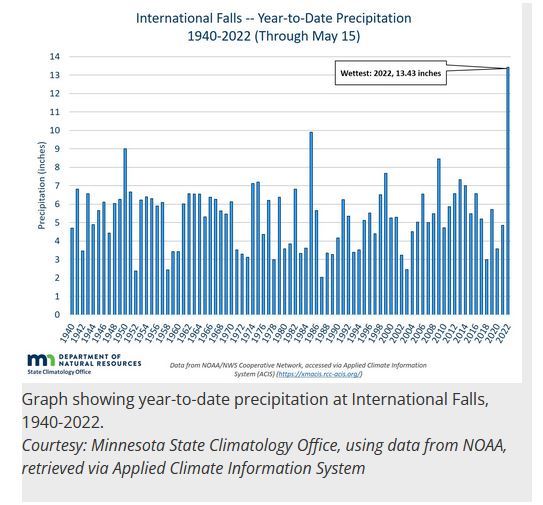
Frequent late-winter snowstorms gave way to frequent rains, and then more recently to bouts of heavy thunderstorms. Through May 15, year-to-date precipitation at International Falls was 13.43 inches, which is about 2.5 times greater than the 1991-2020 normal year-to-date precipitation, and 36% wetter than the next-wettest year on record (1985, which had 9.90 inches through May 15). All of Minnesota's other primary "first-order" stations have above-normal precipitation so far for the year.
Across Minnesota, only the areas near and south of I-90 have seen below-normal precipitation for the year so far. The other approximately 95% of the state has been wet to extremely wet, with the wettest conditions beginning in middle-late March and continuing into May, and concentrated along Minnesota's northwestern, northern, and northeastern edges. The Wolf Ridge Environmental Learning Center, high in the hills above Lake Superior, had the most precipitation in the state through May 15, with 17.90 inches, followed by Grand Portage, with 16.91 inches. In northwestern Minnesota, precipitation to date has been 4-6 times greater than in 2021.
|
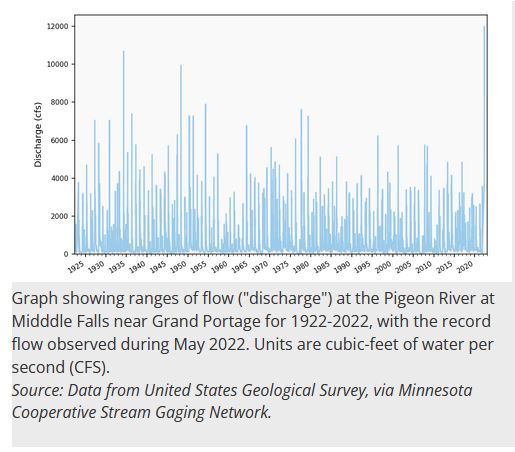
These wet conditions have led to high water and flooding throughout central and northern Minnesota, with major and historic flood conditions in far northern Minnesota, along and near the Rainy River. Additional high flows have occurred on the other side of the Laurentian Divide, with streams like the Pigeon River, which flow into Lake Superior, breaking longstanding records. With over 100 years of data, the Pigeon River set its all-time flow record. Major flooding has also affected the Red River on the Minnesota/North Dakota border, though this flooding has not been as historically significant as the floods in far northern and northeastern Minnesota.
The geographic pattern of absolute and relative wetness represents a near "flip" from the worst of the 2021 drought, when the rare "Exceptional Drought" conditions extended in a southwest-to-northeast band from the Red River north of Moorhead, through the Red Lake Nation, and up to the Rainy River, just west of International Falls.
During the dry years of 2020 and 2021, flooding in Minnesota had been isolated, rather limited in breadth and severity, and related mostly to runoff from heavy rainfall events. The flooding in 2022 has been caused by a trifecta of deep snow, persistent or recurrent precipitation, and scattered intense rainfall events, resembling conditions that were more common in Minnesota mid and late-2010s.
Back to top
|
|
