|
Thank you for your interest in volunteering to map urban heat in Hennepin and Ramsey counties this summer. Your efforts will help us better understand extreme heat in the region and prepare communities to be resilient in the face of rising temperatures.
More than 200 volunteer community scientists collected data in Hennepin and Ramsey counties in July 2024 as part of NOAA’s 2024 Urban Heat Island Mapping Campaign.
 The data collected by volunteers was analyzed by a team at CAPA to create detailed maps of the distribution of air temperature and humidity across much of Hennepin and Ramsey counties.
Volunteers in Ramsey County also collected data on air quality. Hennepin County has a robust air quality monitoring network and chose not to collect this additional data.
See the urban heat mapping summary report (PDF, 10 MB) or explore an interactive map of the data. Also see the Ramsey County air quality report.
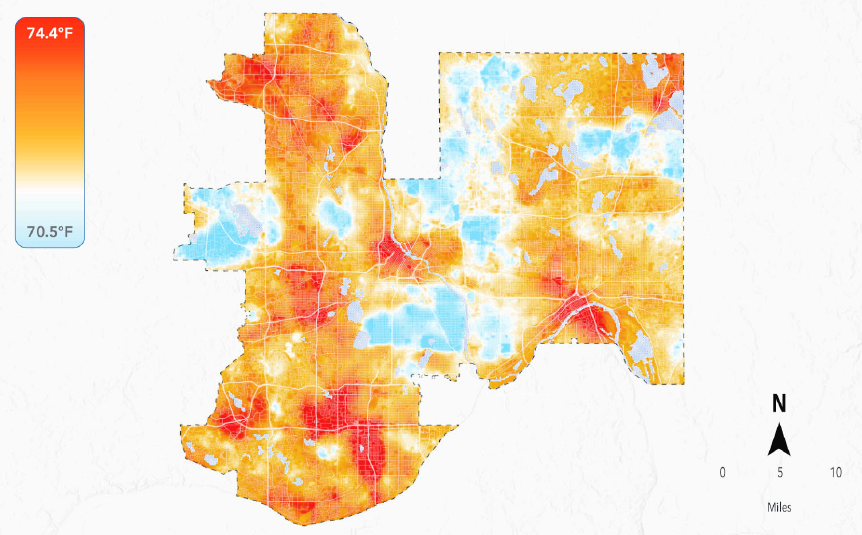
Morning temperature model (6 to 7 a.m.)
 Key observations
 from the data include:
- Highly developed urban areas, such as downtown Minneapolis and downtown St. Paul, had higher temperatures than other areas throughout the day and evening.
- Areas with sparse development but industrial land use, like airports, seem to create a pocket of higher temperatures near residential areas.
- Street trees, greenspace, and water help to alleviate heat in residential areas. For example, neighborhoods near Lake Harriet in Minneapolis and Vadnais Lake in Vadnais Heights are cooler than areas without shade, greenspace, or water.
- The air quality data showed evidence of spatial variability in PM2.5 concentrations across Ramsey County, likely related to industry and transportation corridors.
Please contact urbanheat@hennepin.us to request copies of the raw data for further research or analysis.
Next steps
This urban heat study is extremely timely as the National Weather Service recently announced that 2024 was the warmest year on record in the Twin Cities.
Hennepin and Ramsey counties will use the study data and maps to take the following next steps:
- Compare the urban heat study data with infrastructure and social vulnerability data to determine high priority areas for extreme heat response planning.
- Develop and update heat action plans.
- Share the data with partners and community members for further research and analysis.
- Improve air quality monitoring in Ramsey County in order to strategize long-term adaptation actions and short-term responses during poor air quality events.
Coverage of the urban heat mapping study
Thanks again to everyone who partnered with us on this study and who volunteered their time collecting data. Here is some great coverage captured during the study.
Project overview
Video from Ramsey County (YouTube)
 Interviews with volunteers
Hear from Hennepin County staff and volunteers how the study worked (YouTube)
 Learn more about the urban heat island effect and impacts from study volunteers (YouTube)
 News coverage
Learn more
Hennepin County urban heat mapping study
Ramsey County urban heat mapping study
Contact us
urbanheat@hennepin.us
|